Irish Covid-19 Testing Practices: Claims and Evidence
Published on 08/04/2020
UCD School of Sociology's Dr Seán L'Estrange has conducted the below analysis of Covid-19 testing rates in Ireland. The analysis provides a more in-depth analysis of the current situation compared with some of the public claims made by HSE leadership.
1. CLAIMS
5th April 2020
Paul Reid, CEO of HSE: “We have tested close to 35,000 people. We do rank among the top tier in the world in terms of numbers we are testing. … pro rata we are testing well. While we have had challenges we are up there in terms of top tier countries in the world.” [(opens in a new window)Source]
Ann O’Connor, COO of HSE: 37,000 tests completed with results returned. [(opens in a new window)Source]
2. EVIDENCE
Data Sources:
Ireland: Daily updates from the Department of Health (DoH) provide detailed figures for confirmed cases and confirmed deaths, along with breakdowns by county, age, gender, and institutional location. These updates do not provide data for confirmed recoveries nor for numbers of tests conducted, completed and reported.(i) As a result, the sources for claims about the number of tests undertaken come from spokespersons for the agency responsible for overseeing these tests, chief amongst these being the CEO and COO of the HSE.
Europe and the World: Data sources for other countries against which Ireland’s data can be compared include:
- The Coronavirus Resource Centre at Johns Hopkins University in the United States ((opens in a new window)https://coronavirus.jhu.edu) whose website has a dedicated ‘data centre’ providing graphed data on new cases and confirmed deaths for a selection of countries around the world. As of 6th of April, graphed data of new cases was provided for 10 countries—Italy, Spain, the US, France, UK, Iran, China, the Netherlands, Germany and Belgium. Tabular data for mortality rates (case-fatality and deaths per 100k) is provided for 107 countries.
- The Worldometer Coronavirus website ((opens in a new window)https://www.worldometers.info), an independent data aggregator website based in the United States. (see: (opens in a new window)https://www.worldometers.info/about/) This provides graphed and tabular data for 208 countries and territories that includes figures for confirmed cases, confirmed deaths, confirmed recoveries, active cases, serious/critical cases, total tests as well as per capita calculations for cases, deaths and tests. Direct hyperlinks to the official sources upon which the figures are derived are provided for those countries and territories that have them. Data for numbers of tests is provided for 126 countries and territories.
Comparative Evidence:
Based up the tabular data from the Worldometer website, the following represents the comparative position of Ireland with respect to its Covid-19 testing practices as at 14:26 on the 6th of April 2020.(ii)
1. Rankings:
1. Ireland ranks 40th (out of 126) in terms of the total number of tests, with the site reporting that total number as 30,213.(iii)
2. Ireland ranks 37th (out of 126) in terms of the number of tests per million of population, with a density(iv) of 6,119 per million.(v)
3. Ireland ranks 20th in Europe(vi) in terms of the total number of tests.
4. Ireland ranks 24th in Europe in terms of its density of testing (tests per million)
2. Density of Testing
5. Ireland’s density of testing is 6,119 per million of population.
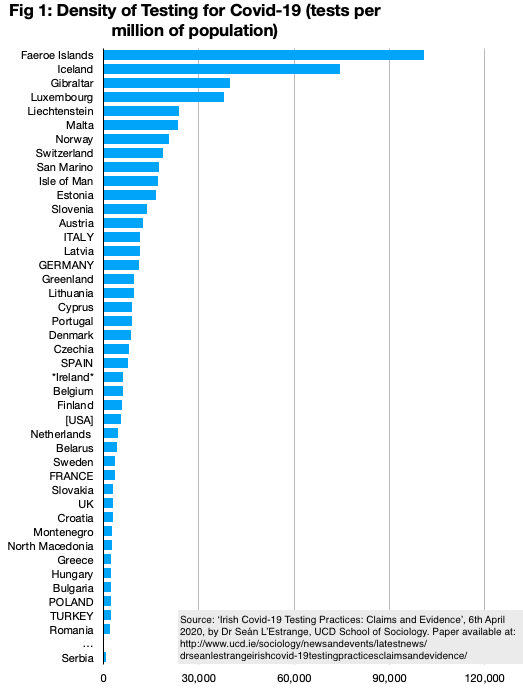
6. The range for density of testing in European countries and territories involves a low of 842 per million (Serbia) and a high of 101,976 (the Faroe Islands).
6.1 The Faroe Islands’ density of testing is therefore 16.7 times that of Ireland while Ireland’s is 7.2 times that of Serbia.
7. Figure 1 below shows Irelands ranked position and testing density for European countries and territories. (NOTE: Large countries (populations of 40+million) are named in CAPITALS. The USA is included for reference purposes.)
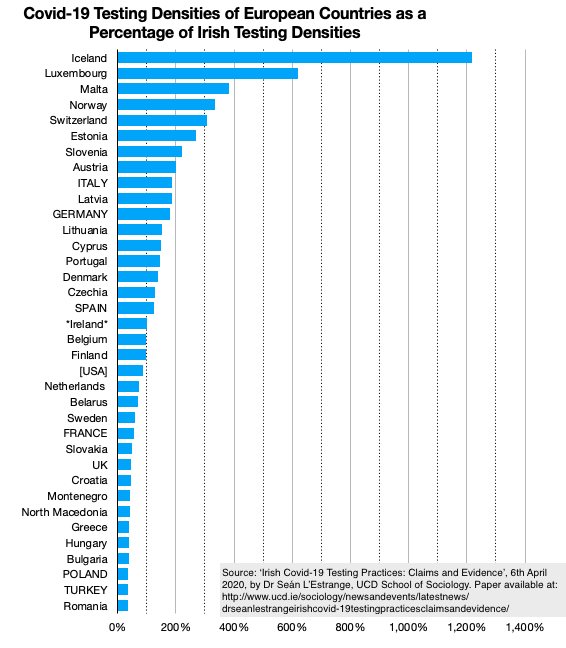
8. Excluding micro-states/territories (those with a population of less than 250,000) and other European states with less than 2,000 tests per million (Bosnia and Herzegovina, Albania and Serbia), this time calculating the density of testing as compared with the Irish figures, Figure 2 shows how Ireland compares to other states, with their testing densities portrayed as a percentage of Ireland’s. Thus Iceland’s density of testing is 1,216% that of Ireland’s (that is 12.16 times higher) while Romania’s is 35% (i.e. Ireland’s is 2.8 times higher). It can be seen from the chart that 17 European countries have testing densities higher than Ireland, with 8 of them have densities more than twice that of Ireland. Some 18 countries have testing densities lower than Ireland’s, with 11 of those being less than half that of Ireland.
9. It can also be seen from this chart that Ireland’s testing density matches that of Belgium and Finland and is closer to that of the USA than to Spain, Germany and Italy. With respect to the USA figures, Ireland’s figures are lower than for 23 of the states in the USA and less than half the testing density of New York and Louisiana. [(opens in a new window)Source]
3. CONCLUSIONS
On the basis of the foregoing, it is difficult to support the claim that Ireland’s testing practices for Covid-19 are in “the top tier” in the world or that “pro rata we are testing well”. It is true that Ireland is not doing badly and it is certainly not amongst the worst in the world by any stretch of the imagination. Yet compared with other similarly sized and resourced states in the European context its performance is decidedly middling. It’s certainly nothing to be ashamed of, but equally it is nothing to be proud of, much less boast about.(vii)
What is worrying, however, is that authorities have been claiming to be following the WHO exhortation to “test, test, test” and to be emulating the South Korean model of “test, track, trace, isolate”. Yet this model presumes and requires a much higher density of testing than is currently being practiced in Ireland.(viii) While the aspiration to follow that model is laudable, the available evidence suggests that in practice Ireland is uncomfortably close to countries most removed from such a strategy—such as Sweden, the Netherlands, and the UK—and is closer to them than to those countries such as Iceland, Luxembourg, Malta, Norway, Switzerland, Estonia, Slovenia and Austria than can genuinely claim to be “in the top tier” on the matter of Covid-19 testing.
Notes:
[i] Reporting on ‘tests’ can refer to the number of tests conducted (i.e. appropriate swabs taken), completed (i.e. analysed in laboratories), and reported (i.e. lab results conveyed to the appropriate authority). There will be an inevitable discrepancy in these figures at any one moment in time, on account of the time it takes for swabs to be sent to laboratories, time taken for laboratories to analyse them, and time taken for laboratories to relay their results to official reporting agencies. The time between swabs being taken and reports being made is currently in the region of 7 days in many European countries, to judge by media reports.
[ii] Note: The Worldometer website provides ‘live’ data updates, so a time-stamp is required for any reference to its published data.
[iii] The figure of 30,213 is less than the figures of “close to 35,000” and “37,000” provided by the CEO and COO of the HSE, respectively, on the same day (5th of April) at their press briefing. This discrepancy between the Worldometer database figure and the HSE figures (themselves discrepant with each other) is a result of lag between public claims and their being aggregated and made public on the Worldometer website. This lag will be the same for all other countries’ data as published on the website and I have therefore used the website figure to ensure that like is being compare with like—to amend the Irish figure to the most recent public pronouncements of HSE officials would invalidate the analysis unless I was in a position to the same for all other countries.
[iv] It is more correct to describe these figures as densities of testing rather than rates. ‘Rates’ typically refer to processes over time as in “the current rate of testing is X per day” while densities refer to (total) tests as a proportion of population and make no explicit reference to a time-frame.
[v] See note 3 on consistent use of data.
[vi] For current purposes ‘Europe’ does not include Russia or Israel/Palestine but does include Turkey and Belarus.
[vii] To put the matter differently, and at the risk of flippancy: If Ireland was a student of mine at UCD, its testing practices would earn it a grade of ‘C’—not bad, but not at all near “top tier”.
[viii] It is true that South Korea’s own testing density is not especially high—at 8,996 per million it is only 47% higher than Ireland’s. But my understanding is that South Korea’s testing practice was highly focussed and concentrated and aimed at containment of the virus within a well-defined geographical region rather than, as is the case in Ireland, a more dispersed practice forming part of a strategy of mitigation rather than containment.