
Distributions
Online lesson from biological data analysis modules

What will you learn?
In this lesson you will learn to:
- Define a distribution
- Explain the concept of an empirical distribution
- Explain the concept of a theoretical distribution
What is a distribution?
A distribution decribes a variable by communicating two important pieces of information.
- It specifies all the possible values that a variable may take (these can be called the possible outcomes).
- It quantifies the relative frequency of each possible value (this can be called the probability of an outcome).
A distribution is very good at describing uncertainty because it can describe events that have multiple possible outcomes.
Below are four examples
Rolling a Dice
Rolling a dice is a classic example of qualitative data (each face of the dice is labelled).
There are six possible outcomes from rolling a dice.
For an unbiased dice each outcome is equally likely, meaning the distribution of outcomes is:
| One | Two | Three | Four | Five | Six |
|---|---|---|---|---|---|
| 1/6 | 1/6 | 1/6 | 1/6 | 1/6 | 1/6 |
The probability of each outcome is a sixth.
Later, we'll see that this is an example of a categorical distribution.
Counting Cats
For one week I recorded the number of times I saw my neighbours' cats in my garden and their coat colour.
Here are my data as a frequency distribution.
| Black | Ginger | Tabby | Tortoiseshell |
|---|---|---|---|
| 5 | 3 | 8 | 1 |
Their are four outcomes (the coat colours). The frequency distribution gives the number of times each outcome occurred (e.g. I saw the Tabby cat eight times).
Human Heights
Human height data is quantitative continuous: Every individual has a different height.
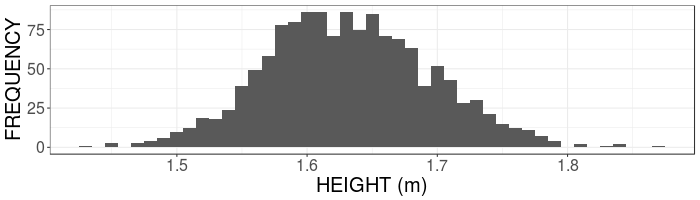
To display this continuous distribution we divide the x-axis (height) into bins (1 cm bins are used above) and count the number of data points within each bin (called FREQUENCY on the y-axis).
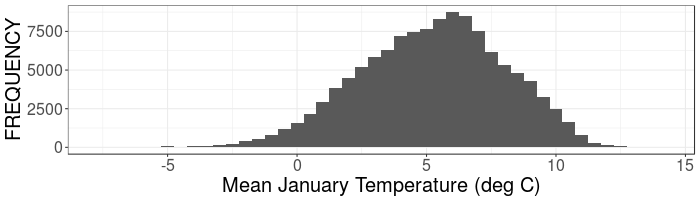
Temperatures
Below is the distribution of mean daily temperatures for January across Ireland. The data are from 1995-2016
This temperature data is quantitative continuous.
To display the distribution a bin width of 0.5 deg C has been used.
Empirical Distribution
(Video 1 min 17 sec)
Wolf Example
Below is the empirical distribution of cortisol concentrations measured from a sample of 103 wolves
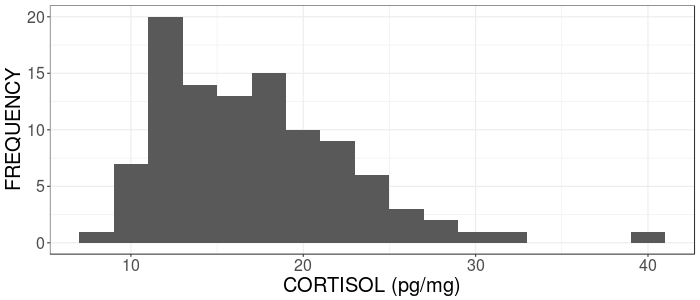
This module uses these data on cortisol concentrations measured from hair samples of wolves in Canada (described here).
Theoretical Distributions
(Video 1 min 58 sec)
Normal Distribution
The Normal distribution is a bell shaped curved that has a well defined mathematical description.
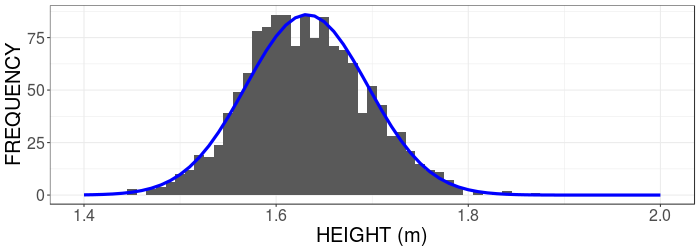
Above is a Normal distribution (blue curve) being used to mimic human height data (described here)
Categorical Distribution
The categorical distribution describes the probabilities of a finite number of outcomes. The mathematical description of the categorical distribution is the probabilities for each outcome.
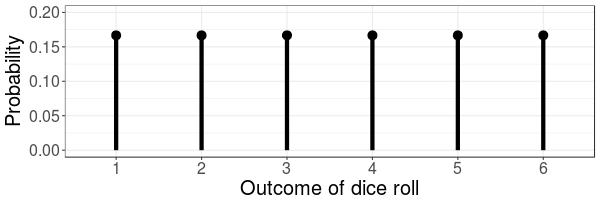
Above is a catagorical distribution for the outcomes of rolling an unbiased dice. Each outcome has a probability of 1/6.
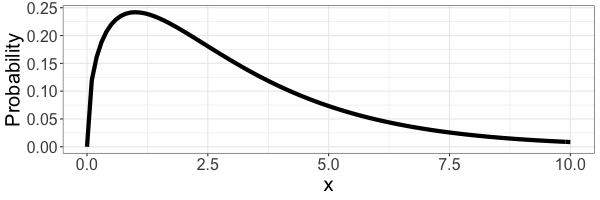
Gamma Distribution
The Gamma distribution is a skewed theoretical distribution. It has a well defined mathematical description.
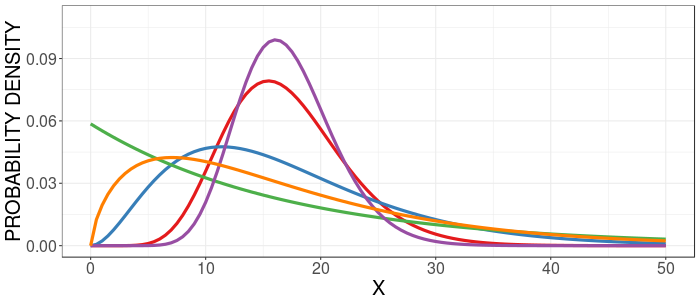
Above are five Gamma distributions with differing amounts of (right) skew.
Log-normal Distribution
The log-normal distribution is another skewed theoretical distribution. It has a well defined mathematical description.
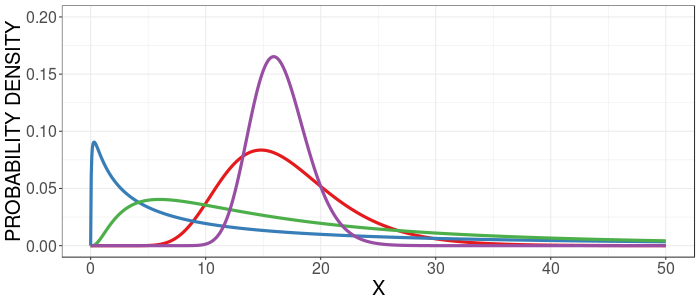
Above are four log-normal distributions with differing amounts of (right) skew.
Binomial Distribution
The binomial distribution describes the number of successes and failures from repeatedly performing a task with a constant probability of success. It has a well defined mathematical description.
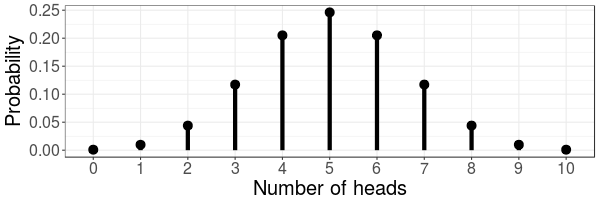
Above is the binomial distribution for tossing a coin 10 times. The outcomes are the number of heads (ranging from zero to ten) and the distribution gives the probability of each outcome.
Chi-squared Distribution
The Chi-squared distribution describes the distribution of outcomes from squaring values from a normal distribution and then adding them up. It has a well defined mathematical description.
Above is the distribution of outcomes by taking three values drawn from a normal distribuiton (with mean of zero and standard deviation of one), squaring each and adding up the results. This is a Chi-squared with three degrees of freedom.
Poisson Distribution
The Poisson distribution describes a quantitative discrete variable and is related to the binomial distribution. It has a well defined mathematical description.
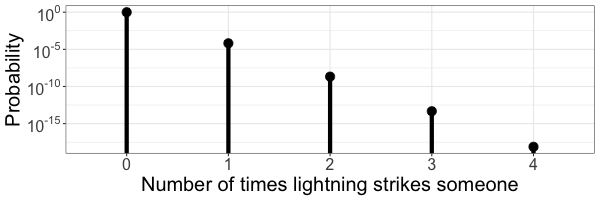
Above is the Poisson distribution for describing the number of times a person will be hit by lightning in their lifetime, assuming the probability that a person is struck by lightning in their lifetime is about 15,000 to one.
Wolf Example
The Gamma or log-normal distributions could both mimic the empirical distribution of the wolf cortisol data
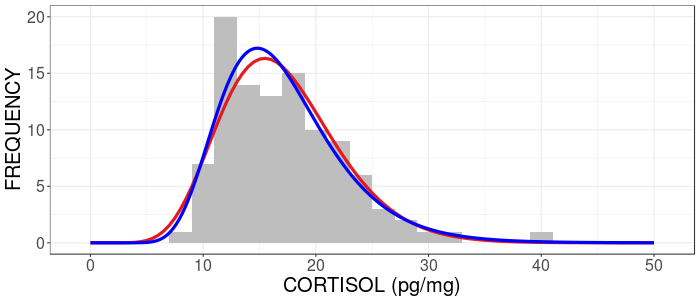
Above is the empirical distribution of cortisol (grey bars), a Gamma distribution (red) and a log-normal distribution (blue).
Distribution Shapes
A distribution can be broadly described by its shape.
Below are some words used to describe a distribution's shape

Symmetrical
A symmetrical distribution looks identical when it is reflected around its centre
Below is a Normal distribution with mean=12 and standard deviation=5
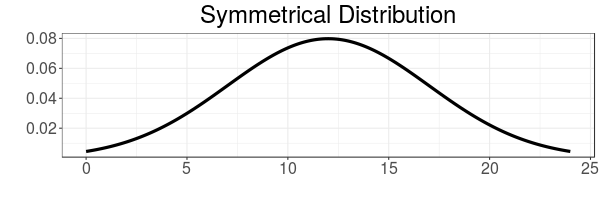
The Normal distribution is symmetrical about its mean
Skewed (1)
A skewed distribution is asymmetrical.
Below right is a Gamma distribution with mean=12 and standard deviation=5. The symmetrical Normal distribution is shown in grey.
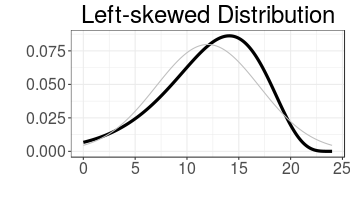
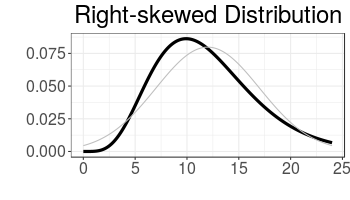
Right-skew (positive skew) has a distribution with an extended tail on the right
Left-skew (negative skew) is the opposite of right-skew
Right-skew (left-skew) commonly causes the mean to be larger (smaller) than the median, because the mean is influenced by extreme values.
Skewed (2)
(Video 1 min 9 sec)
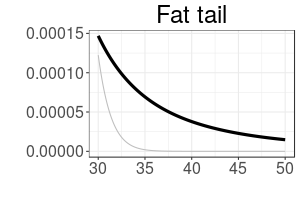
Over-dispersion
An over-dispersed distribution has an excess of extreme values (i.e. it has fat tails).
Below left is a t-distribution distribution, shifted to have mean=12 and standard deviation=5. The equivalent Normal distribution (no over-dispersion) is shown in grey. On the right is a zoom into the tail of the distribution showing the 'fat-tail'
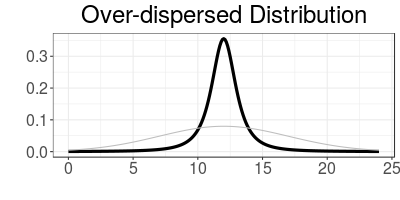
Over-dispersed is also known as platykurtic (platy- means broad)
Under-dispersion
An under-dispersed distribution has a deficit of extreme values (i.e. it has thin tails).
Below is a Uniform distribution with mean=12 and standard deviation=5. The equivalent Normal distribution (no under-dispersion) is shown in grey.
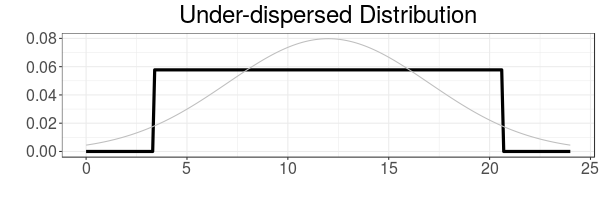
Under-dispersed is also known as leptokurtic (lepto- means slender)
Have a go ...
The section at the start called 'What is a distribution?' gives four examples of distributions (dice, cats, heights and temperatures).
For each of these four examples:
- Specify whether the example is of an empirical or a theoretical distribution
- Describe the shape of the distribution using the terms discussed in this lesson (symmetric, right-skewed, ...)
Key Points
- The distribution of a variable describes the relative frequency of outcomes
- Data in a sample has an empirical distribution
- No two samples have the same empirical distribution
- A theoretical distribution has a precise mathematical description
- A theoretical distribution has parameters that modify the shape of the distribution
- Theoretical distributions can be used to 'mimic' empirical distributions
- Empirical and theoretical distributions can be described by their shape