
Statistical Modelling
Online lesson from biological data analysis modules

What will you learn?
In this lesson you will learn to:
- Describe the concept of a statistical model
- Explain some examples of how statistical models are used
- Describe how one data set can be described by several statistical model
Definition
A statistical model is a theoretical distribution. It aims to describe a variable from a population. Observations from the population (i.e. the sample) are used to find plausible values for the parameters of the statistical model.
Statistical models are used to:
- Infer properties of a population
- Test hypotheses about a population
Below are a couple of videos giving introductory examples of statistical modelling.
Introductory Dice Example
(Video 2 mins 45 sec)
Introductory Human Height Example
(Video 2 mins 8 sec)
Infering the Average of a Population
We use the human height data (HEIGHT.CSV) to illustrate the use of a statistical model to infer a property (the average) of a population.
Question:
What is the average height of women aged 20-30 years in the USA?
We will infer two numbers:
- an estimate of the average height of women
- an estimate of the uncertainty in this estimated average
Example: Infering an Average
(Video 3 mins 33 sec)
R code for Human Height Hodel
		  # Sample's mean and standard deviation
		  sample_mean = 1.63201
		  sample_sd = 0.063306

		  # Number of observations in the sample
		  n_obs = 1364

		  # Simulate one sample from a normal distribution
		  # with the same number of observations as the sample
		  sim = rnorm(n_obs, mean=sample_mean, sd=sample_sd)
Uncertainty in an estimate
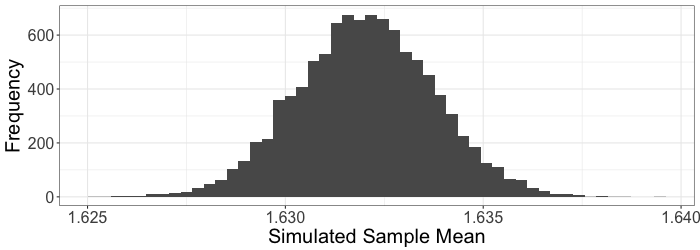
The standard deviation from the histogram above is 0.0017 m.
Our final answer is:
The average height of women aged 20-30 years in the USA is 1.632 m (s.e. = 0.002 m).
Statistical Theory
Instead of simulating from the statistical model, statistical theory can be used to obtain the uncertainty in the estimated population mean.
Statistical theory says that: $$\text{Standard deviation of estimated means}=\frac{\sigma}{\sqrt{n}}$$ where $\sigma$ is estimated by the standard deviation of a sample and $n$ is the number of observations in the sample.
Use $\sigma=$0.063306 m and $n=$1364 observations, to see how this theory compares to our simulated result.
Testing a Hypothesis
We are going to use the dice example to illustrate the idea of using statistical models to test a hypothesis.
Question: Is our dice biased?
The two possible answers to this question can be written as hypotheses:
Hypothesis (H1): The dice is biased.
Null-Hypothesis (H0): The dice is unbiased.
Sample Data versus Population
I have a dice that I have rolled 20 times, giving these results:

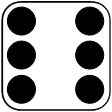


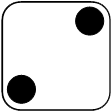
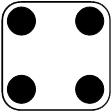
This is a sample of 20 observations from the population.
In this case, the population is an infinite number of rolls of this dice (we will never have complete information about this population).
Example: Is a dice biased?
(Video 5 mins 19 sec)
R Code for Dice Models
		  # The observed data from 20 dice rolls
		  dice_data = c(5, 6, 1, 3, 2, 3, 1, 4, 3, 3, 6, 3, 1, 1, 2, 1, 6, 4, 5, 1)
		  # Define the categorical distribution for the null, H0 model
		  outcomes = c(1, 2, 3, 4, 5, 6)  # All possible outcomes from a dice
		  probability_H0 = c(1/6, 1/6, 1/6, 1/6, 1/6, 1/6) # Outcome probabilities

		  # Create one simulation of 20 dice rolls using the null-hypothesis model
		  sample(outcomes, size=20, prob=probability_H0, replace=T)
		  # Define the categorical distribution for the H1 model
		  outcomes = c(1,2,3,4,5,6)  # All possible outcomes from a dice
		  probability_H1 = c(6/20, 2/20, 5/20, 2/20, 2/20, 3/20) # Outcome probabilities

		  # Create one simulation of 20 dice rolls using the null-hypothesis model
		  sample(outcomes, size=20, prob=probability_H1, replace=T)
Quantifying Bias: a Test Statistic
The bias from 20 dice rolls can be quantified by calculating a statistic. $$\text{Bias} = \sum_{i=1}^6 (p_i - 1/6)^2$$ where $p_i$ is the relative frequency of the ith outcome. If the number one appeared six times in 20 rolls, $p_i=6/20$.
An unbiased dice has $\text{Bias}=0$
A biased dice that always rolled a one has $\text{Bias}=5/6$.
Our 20 observations give a bias of 0.0383.
We will test for bias in our dice using this test statistic
How extreme is the bias in our data?
Using the null-model to simulate 10000 sets of data, each containing 20 dice rolls, we can calculate the distribution of bias from an unbiased dice.
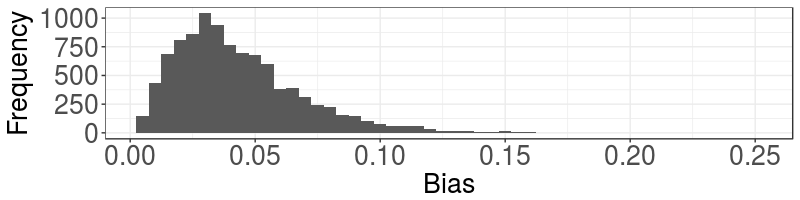
From this distribution we can calculate that 51% of the simulated data had a bias at least as large as the observed bias of 0.0383.
Key Points
- Research questions are about the population not the sample
- A statistical model aims to describe the distribution of data from the population
- The parameters of a statistical model are estimated from a sample of data
- A statistical model can be used to simulate a sample of data
- A statistical model can be used to estimate the mean of a population
- A statistical model can be used to estimate the uncertainty in an estimate (the standard error)
- Hypotheses can be tested by comparing two statistical models: a null-model and an alternative-model