
Below are a couple of videos of our laboratory controlled burns. These videos last for ~1min, but in reality these smouldering burns take several hours. The burns are for peats with ~0% and 100% moisture content (measured as a percentage of dry weight).
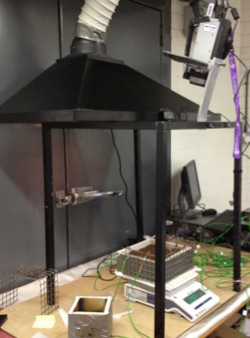
The experimental setup is shown on the right. The burn box is 20cm x 20cm and 10cm deep. Combustion is started (top of the videos) by passing a controlled electrical current through a coil of heating wire (100W for 30 mins).
The smouldering propagation is recorded with: a webcam, an infrared camera, thermocouples inside the peat and an electronic balance. These data are then analysed in Matlab and R to extract the velocity of the smouldering combustion front, the mass loss rate of the sample and the temperature at the smouldering combustion front. These data can be used to parameterise models of smouldering combustion.

Peat smouldering experiment (peat at ~0% moisture content). Left hand image is visual movie showing pyrolysis front, right hand image is an infrared movie showing the exothermic region (oxidation). The colour scale on the infrared image is room temp (dark blue) to ~400 degrees C (red).
Peat smouldering experiment (peat at 100% moisture content). Left hand image is visual movie showing pyrolysis front, right hand image is an infrared movie showing the exothermic region (oxidation). The colour scale on the infrared image is room temp (dark blue) to ~400 degrees C (red).
Example of a peat burning experiment showing the radial spread of the fire from a central ignition point. The left-hand video is a visual webcam video of the smouldering peat. Right-hand is an infrared video of the same peat burn. A 10 cm long glowing coil ignites the peat from the centre of the peat sample. The self-sustained spread is produced in a radial fashion until the box walls. Experiments like that are used to test the influence of laboratory conditions, such as air flow, to the smouldering fire spread in fine-scale burning experiments.
Example of data collected during a peat burning experiment. Top left image is a webcam recording of the smouldering peat. Top right image is an infrared image of the same burn, bottom is a graph of the radiative power detected from one pixel of the infrared image (pixel marked with a white dot). The peat is ignited along one site of the box using a glowing coil covered by dry peat. The smouldering fire self-spreads horizontally through the peat sample. Each pixel in the infrared image is a power density value (kW/m^2) and is used to locate the smouldering front inside the box. The graph below shows the power density of the pixel highlighted in white in the visual and infrared images. There is no change in the power intensity until the smouldering front gets very close to the pixel causing the power density to increase rapidly due to the start of exothermal oxidation reactions. The values are high for the duration of the peat and char oxidation and then they have a slower cool down phase. Each pixel has similar graphs that can be used, for example, to estimate the spread rates of the fire.