
Geometric Visualisation
Overview
This Learning Enhancement project has been funded through the HEA and the National Forum for the Enhancement of Teaching and Learning.
| PROJECT TITLE: | Geometric Visualisation |
|---|---|
| PROJECT COORDINATORS: | Associate Professor Pauline Mellon |
| COLLABORATORS: | Tutor Giuseppe Cotardo |
| MODULE: | Geometry MST30070 |
| STUDENT COHORT: | Total of 52 students Undergraduate: BA/BSocSc Stage 3, BSc Maths and Science Education Stage 4 (Full-time) and Postgraduate: Higher Diploma in Mathematical Studies (Full-time) |
Background
Geometry has been formally studied for more than 2,300 years, since Euclid's Elements were published circa 300 BC. However, seeing mathematical formulae for objects in geometry and being able to visualise the resulting images in 3D is still difficult for many students. While students may be shown pre-prepared 3D images, this does not directly engage the student nor does it necessarily improve their own visualisation skills.
Such visualisation skills reap myriad benefits in terms of making the mathematical theory feel less abstract. It also increases a student’s understanding and enhances the development of the student’s own mathematical intuition. It is beneficial for all students of geometry but especially for those who will progress to teach mathematics, and therefore geometry, themselves in secondary schools.
Goals
This project ‘Geometric Visualisation’ was intended to make the Teaching and Learning of undergraduate Geometry more engaging and autonomously accessible to all learners.
This project aimed to increase students’ visualisation skills and to develop their mathematical intuition and insight in the subject area of Geometry. The pilot project involved all 52 students taking a stage 3/stage 4 module in differential geometry. Since Geometry is a Teaching Council core competency for teaching second level mathematics in Ireland, a key aim was to give future second level teachers a 'feeling' for how the formulae of mathematics and the theory manifest visually. This is done by getting them to actively visualise curves, surfaces and other geometrical objects themselves.
The project also aimed to increase the digital mathematical literacy of the students and to develop new teaching resources for wider use within the School of Mathematics and Statistics.
The Innovative Approach
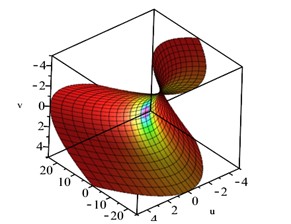
This project designed and introduced five interactive apps, to enable the graphing of curves, surfaces and other three dimensional mathematical objects. The apps, which we refer to as visualisation apps, or simply visapps, were written using the mathematical software ‘Maple’. The visapps are designed to be used easily and independently by students and to motivate and stimulate the development of their mathematical visualisation skills. In visapps the students may change a parameter in a geometrical formula and see how that parameter change affects the resulting 3D image. In this way a student develops a ‘feel’ for what the parameters intuitively ‘mean’.
As well as being a reusable and innovative product, the visapps were themselves developed in an innovative and highly collaborative manner. In addition to the module co-ordinator and tutor, who together designed and developed the visapps, the 52 students of the module MST30070 ‘Geometry’ were key partners during the roll-out and review stage of the project.
Results
There are five individual visapps and the development of each visapp followed the same seven steps below. A new visapp was developed and introduced every other week, starting in week 2 of term and finishing in week 12.
Steps in the development of each visapp:
- The visapp was designed, written and reviewed by the module co-ordinator and tutor.
- We recruited eight student volunteers from MST30070.
- We trained the student volunteers in the use of the visapp.
- The student volunteers then demonstrated the visapp use to their classmates in ‘Visualisation Sessions’. The visualisation sessions were short sessions held every other week in the tutorials.
- We upgraded the visapp, based on feedback from the visualisation session.
- We surveyed the students of the module after all of the visualisation sessions were complete.
- A final report was written, including the actual visapps, the underlying code, the mode of practice, and the results of the final survey.
The survey showed that the visapps support autonomous student learning in geometry by developing visualisation skills. Students felt more comfortable with the objects of study. An unexpected benefit was an overall increased engagement of students with the module. The overall student feedback was very positive.
One student quoted:
The maplets helped me to visualise the various surfaces and curves we were studying which made them less abstract. By enabling me to change one (or more) of the variables I was able to gain a better understanding of the influence of the various parameters on the overall shape / orientation. For example, by changing the constant in the equation of a plane I could really see what is meant by a translation.
Resources:
As they are designed for easy autonomous student use, the visapps were fortuitously useful in the unexpected move to online learning in 2019/20 and 2020/21.
The following new resources developed are available for future use, including:
- The five visapps themselves are available to all future students and teachers of geometry.
- In addition to the visapps themselves, there is also a well worked-out protocol of how to use the visapps in both the lectures and tutorials.
- There is a well established protocol for the choosing and training of the student volunteers and the running of the Visualisation Sessions.
- The code underlying the visapps is available, should future users wish to adapt the apps.
There is a 20 page report on the entire project, including a section for each of the five visapps.