Image Analysis
We have expertise in several cell analysis packages including open-source software ImageJ (NIH) and CellProfiler (Broad Institute) and proprietary software Columbus (Perkin Elmer) and Harmony (Perkin Elmer).
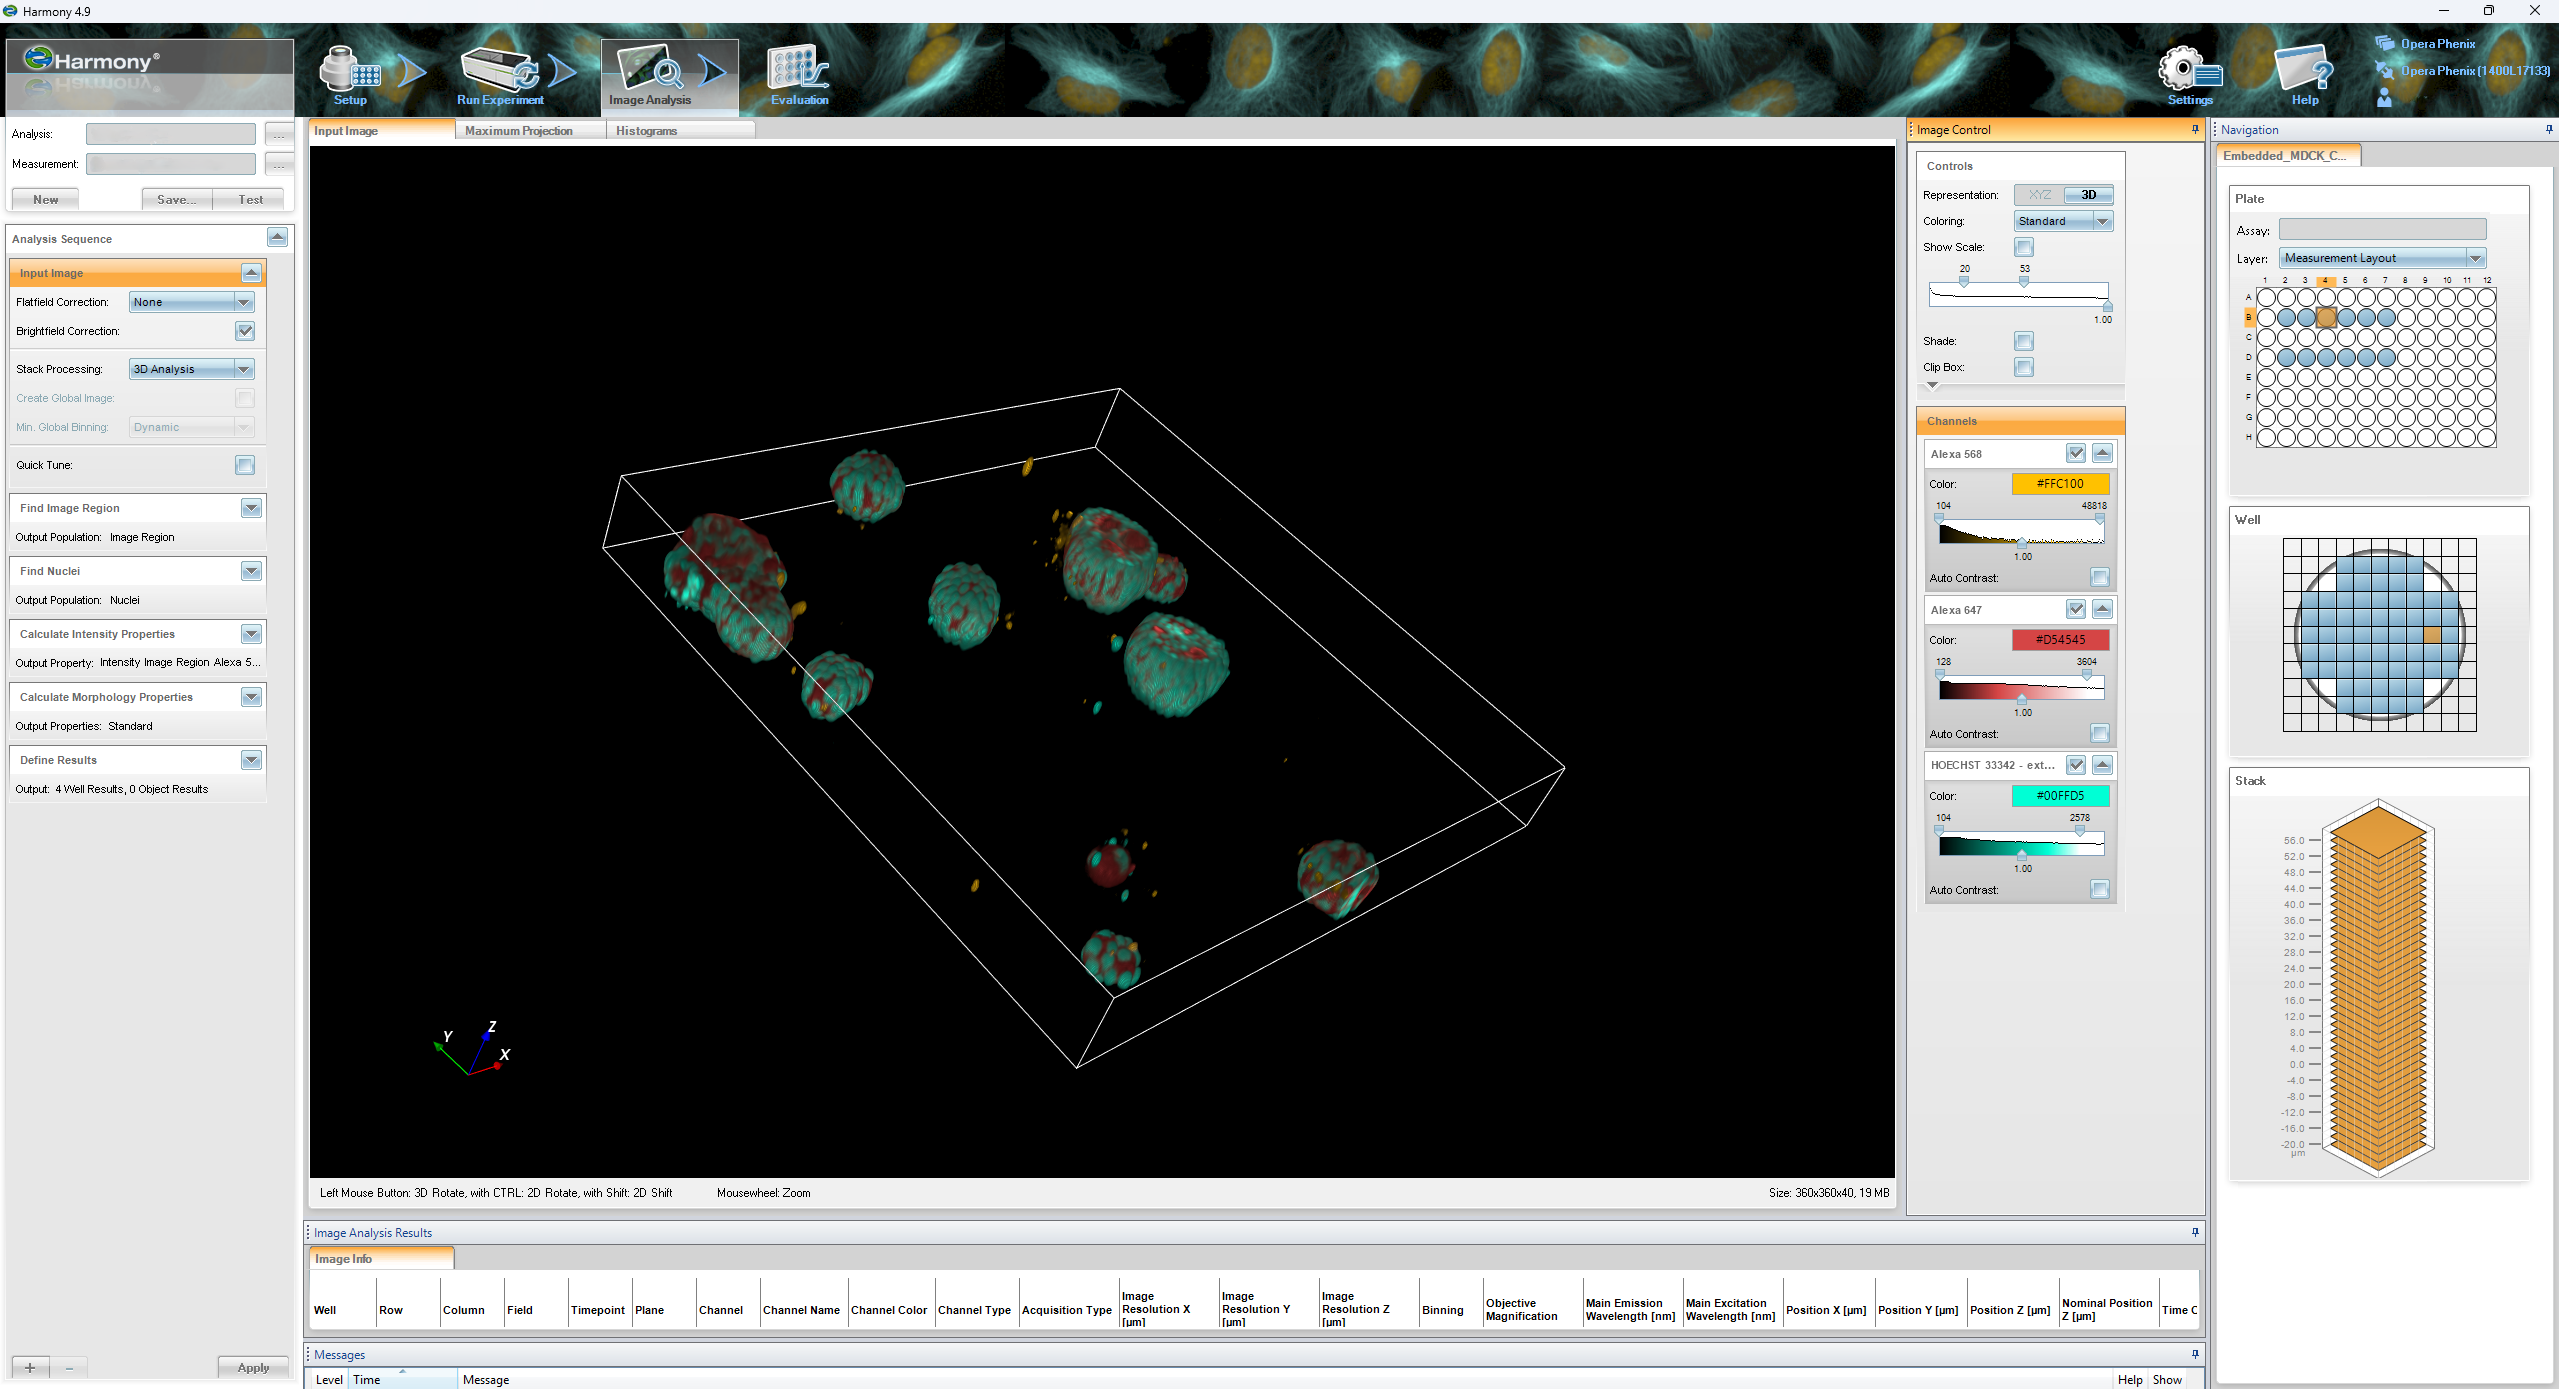
Harmony High-Content Imaging and Analysis Software
The Harmony high-content image analysis software is an advanced image analysis software designed for detailed quantitative phenotyping of cells in a population. It utilises a series of ‘building blocks’ to allow segmentation of cellular features and their subsequent analysis. Harmony is capable of working with three-dimensional confocal data and making volumetric and surface area measurements from such data sets.
Features:
- Custom design of image analysis solutions using graphical ‘building blocks’
- Advanced segmentation of nuclei, cells, cytoplasm and other cellular structures
- Quantification of cell and subcellular morphology features
- Quantification of cell and subcellular intensity features
- Quantification of cell and subcellular texture features
- Quantification of 3D data (for example from spheroids or organoids)
- Creation of stitched images from multiple fields-of-view
- Machine learning and classification of complex phenotypes
- Automated graphical representation of output data
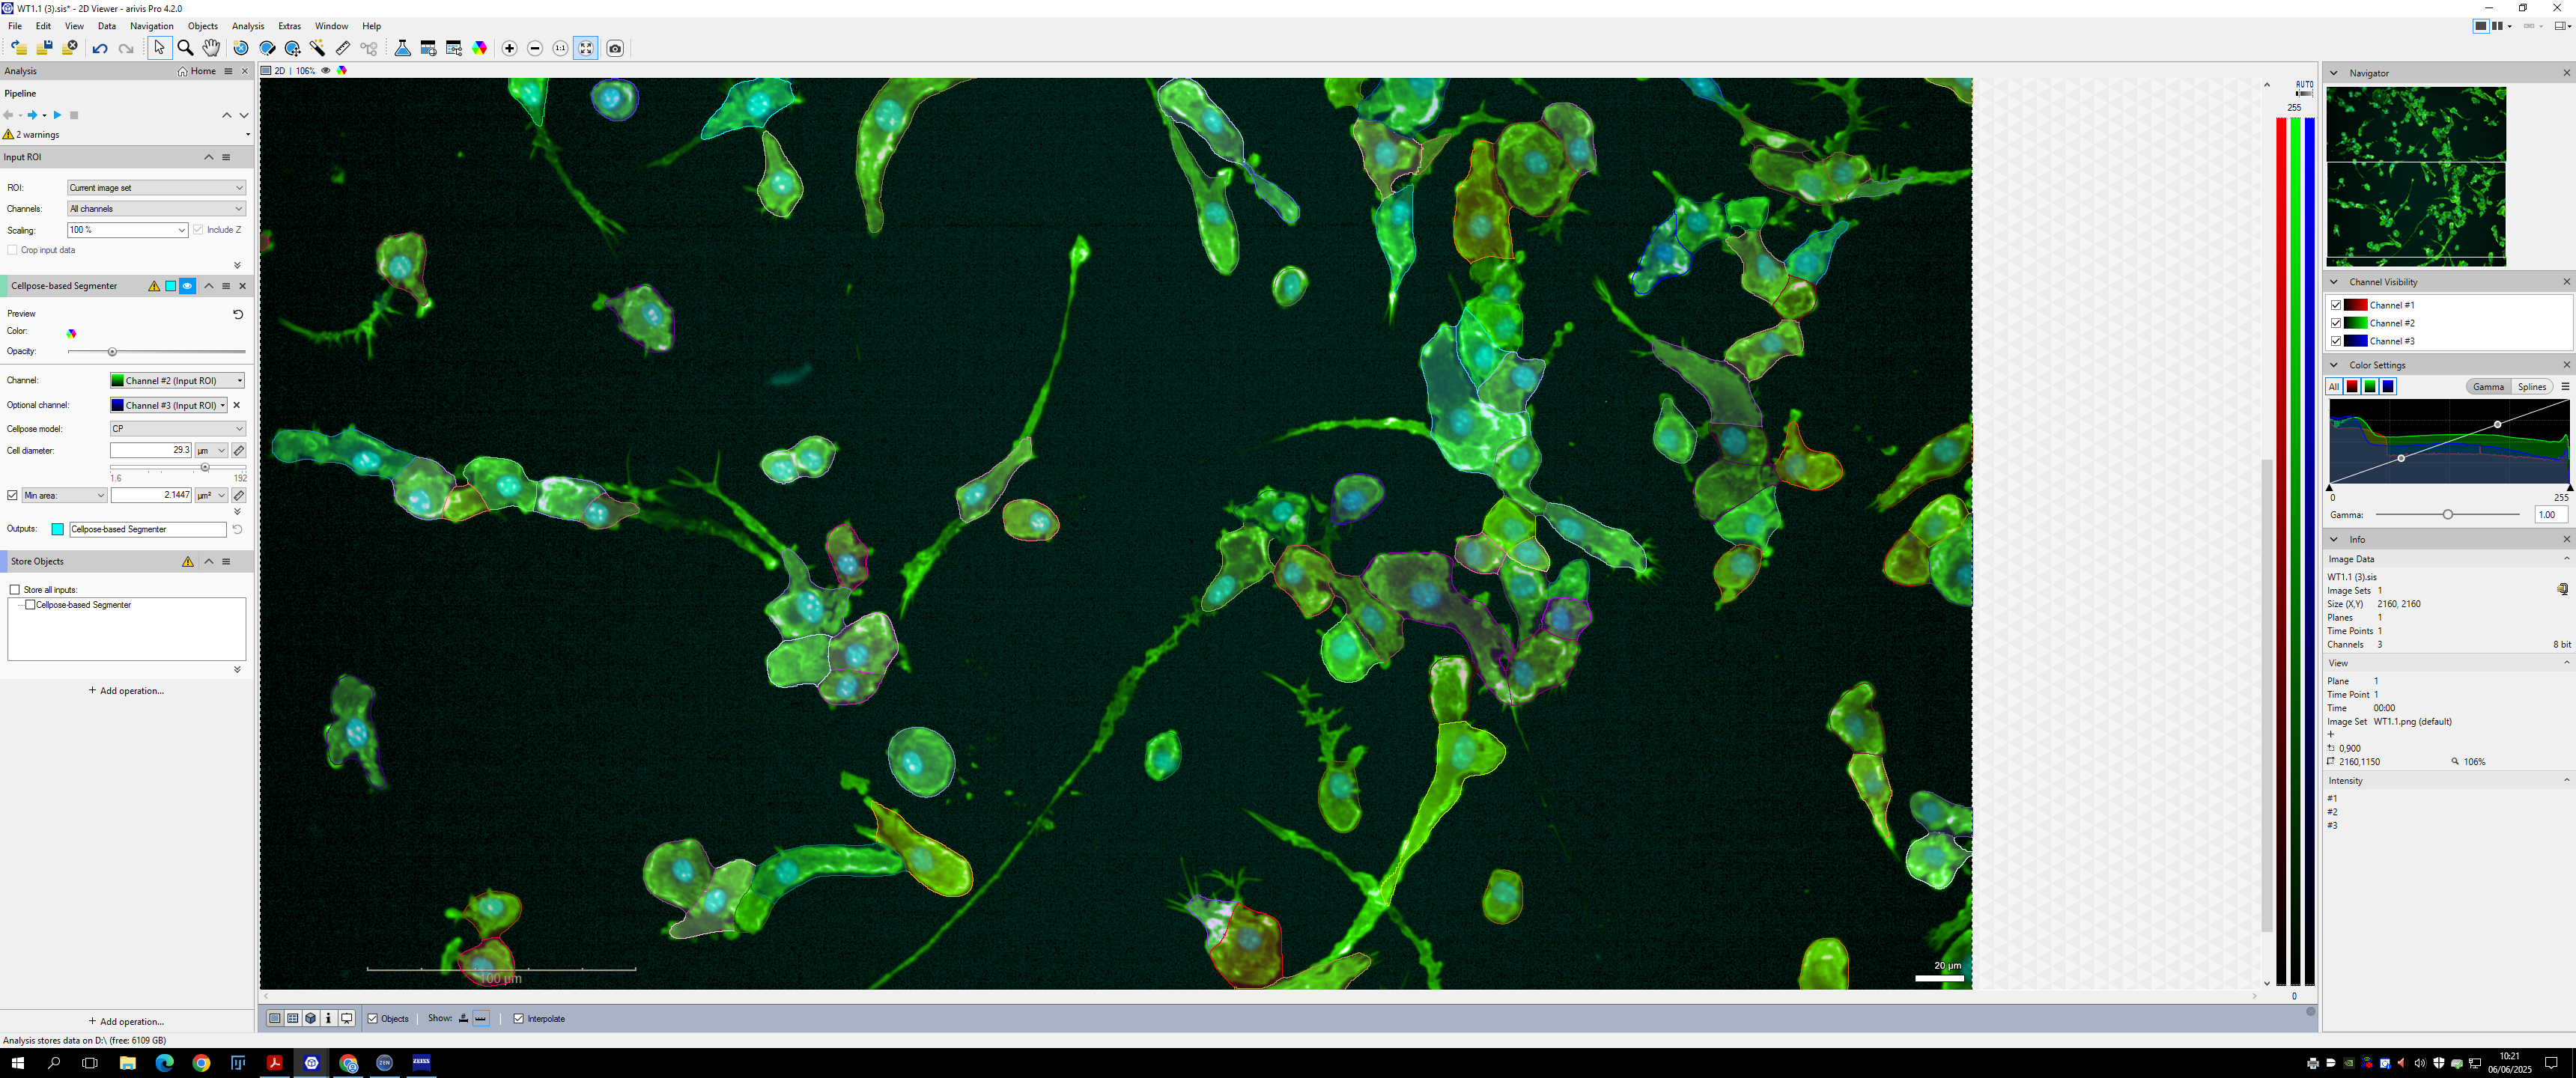
Zeiss Arivis Pro & Zeiss Zen Microscopy Software
High performance image analysis workstation running both Arivis and Zen image analysis software solutions. Software works with all image file types.
Features:
- Constrained iterative deconvolution
- Deblurring
- Tracking of objects over time course experiments
- Preparation of storyboard animations
- Advanced segmentation of nuclei, cells, cytoplasm and other cellular structures
- Quantification of cell and subcellular morphology features
- Quantification of cell and subcellular intensity features
- Machine learning and classification of complex phenotypes
- Automated graphical representation of output data