Explore UCD

UCD Home >
Mockup of an analytics report with a Google Analytics logo
overlay image

Google Analytics 4

Google Analytics 4 (GA4) is the latest generation of Google's web analytics service, designed to provide a better way to understand user behavior across websites. UCD has now fully transitioned to GA4 and enhanced Google Analytics dashboards are available on InfoHub. Learn more about the improvements and how to access them.

A screenshot of the new Google Analytics dashboard available on InfoHub

Google Analytics Dashboards

Enhanced Google Analytics reports are now available on InfoHub. Due to technical limitations following the switch to Google Analytics 4 (GA4), the previous dashboards often encountered errors and were slow to load. The new dashboards are connected to a data warehouse which means you will no longer run into the same errors and the charts will load much faster.

The design has also been refreshed with the charts now split over three pages: Overview, Page Performance, and User Engagement. Historical data is available from the beginning of 2024 and data will be retained for a maximum of two years.

InfoHub screen for My Unit Websites with arrows pointing ro analytics buttons

Accessing the Dashboards

You can access the dashbaords by logging into InfoHub and going to:

Systems > Website Management > My Unit Websites

Click on the Google Analytics button at the top of the report to see a combined dashboard of all websites for your school or unit that you have access to. You can filter the results with the controls at the top of the dashboard.

Alternatively, click on the Analytics button beside each website entry to see statistics for that site only.

If you have any questions please see the FAQ below or conact us via the IT Support Hub.

FAQ

The Google Analytics dashboards are available on InfoHub at Systems > Website Management > My Unit Websites.

If you currently do not have access you must be granted access by EAG with the authorisation of the website owner. The website owner can open a call with IT Support Hub to request access.

If you have access to your own local Google Analytics account, you may notice a data discrepancy in Active User figures between the dashboards on InfoHub and what is reported in the GA4 interface.

This is because the data warehouse used for the dashboards stores and aggregates user activity at a daily level for performance and ease of querying. Consequently, the Active Users metric in the InfoHub dashboards represents a sum of daily active users, not a count of unique users over the entire selected date range, as GA4 typically provides. As a result, the user count on the reports InfoHub can be higher than what is reported directly in GA4.

An Active User is a user who has had an engaged session on your website.

An engaged session is one that lasts 10 seconds or longer, has 2 or more pageviews or screenviews, or includes at least one conversion event.

A Session is a group of user interactions on your website that take place within a given time frame. A session can include multiple pageviews, events, and other interactions. By default, a session ends after 30 minutes of inactivity. If a user becomes active again after this period, by viewing another page or triggering an event for example, a new session will begin.

A Landing Page is the very first page a user sees when they land on ucd.ie during a session.

Inside Google Analytics 4

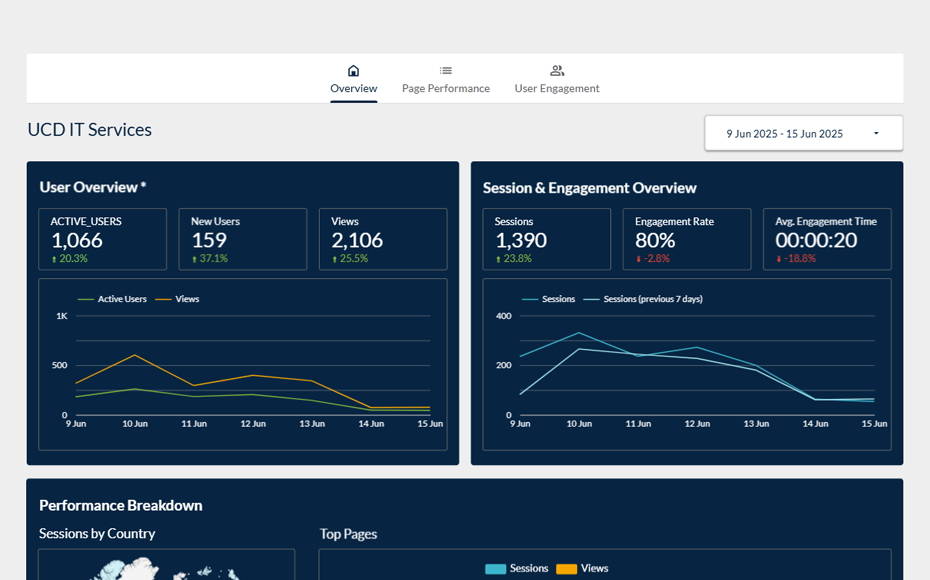
Google Analytics 4 (GA4) is Google's latest web analytics platform, fundamentally shifting from its predecessor (Universal Analytics) to an event-based data model. This means all user interactions, from page views to clicks and video plays, are tracked as "events," providing a more flexible and granular understanding of user behavior. GA4 offers enhanced privacy controls, and leverages machine learning for predictive insights, helping website owners to understand the complete customer journey and make more informed decisions.

In Universal Analytics, the main focus was on tracking individual sessions and their interactions with a website. GA4, on the other hand, emphasizes tracking the behavior of users across multiple devices and platforms. This shift acknowledges the growing complexity of user journeys in today's interconnected digital landscape.

Another significant change in GA4 is the enhanced event tracking system. While Universal Analytics primarily relied on pageviews and predefined events, GA4 introduces a more flexible and customizable event tracking mechanism. It allows businesses to define and track specific events that align with their unique goals and objectives, providing more granular insights into user interactions.

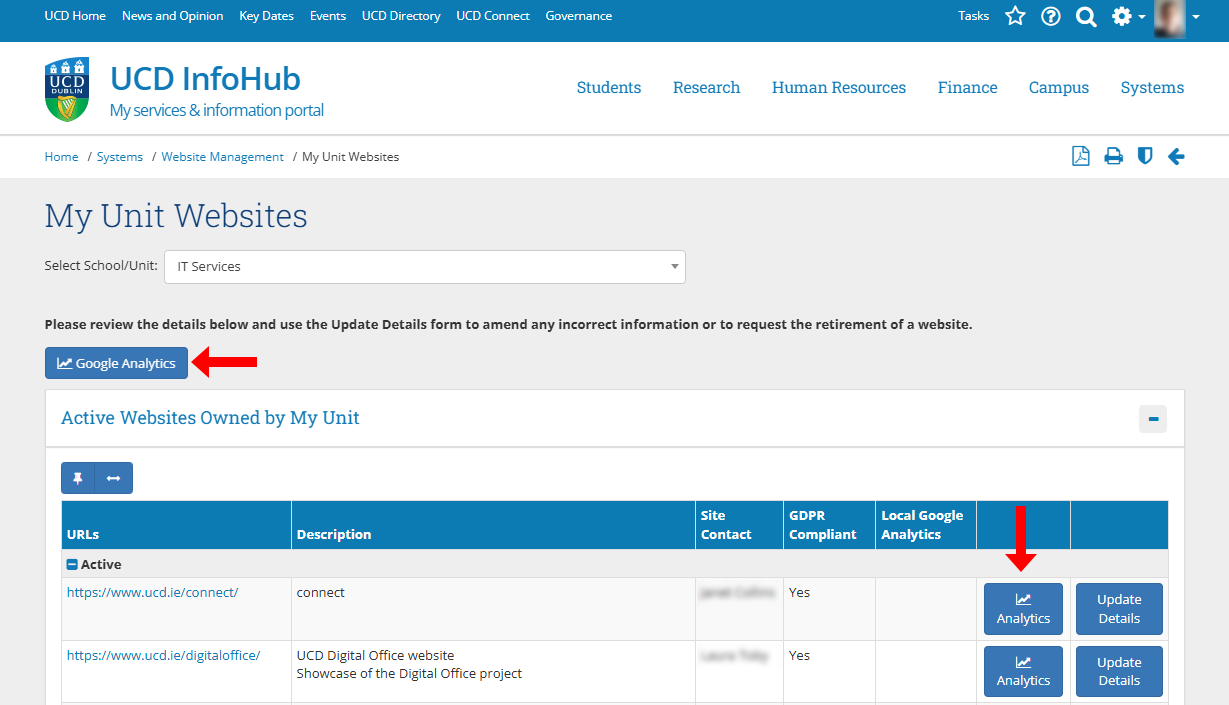
However, perhaps the most relevant change for the University is that GA4 includes improved data privacy features to align with evolving regulations and user expectations. It provides more options for data control and management, ensuring compliance with privacy policies and offering users more transparency and control over their data.