
Amy Carroll
Senior Project Manager
EAG - IT Services

This webpage will provide you with all the key information in relation to the Tableau project and how you can learn more. For further information on the project, you can reach out to any member of the project team, please see the contact details below.
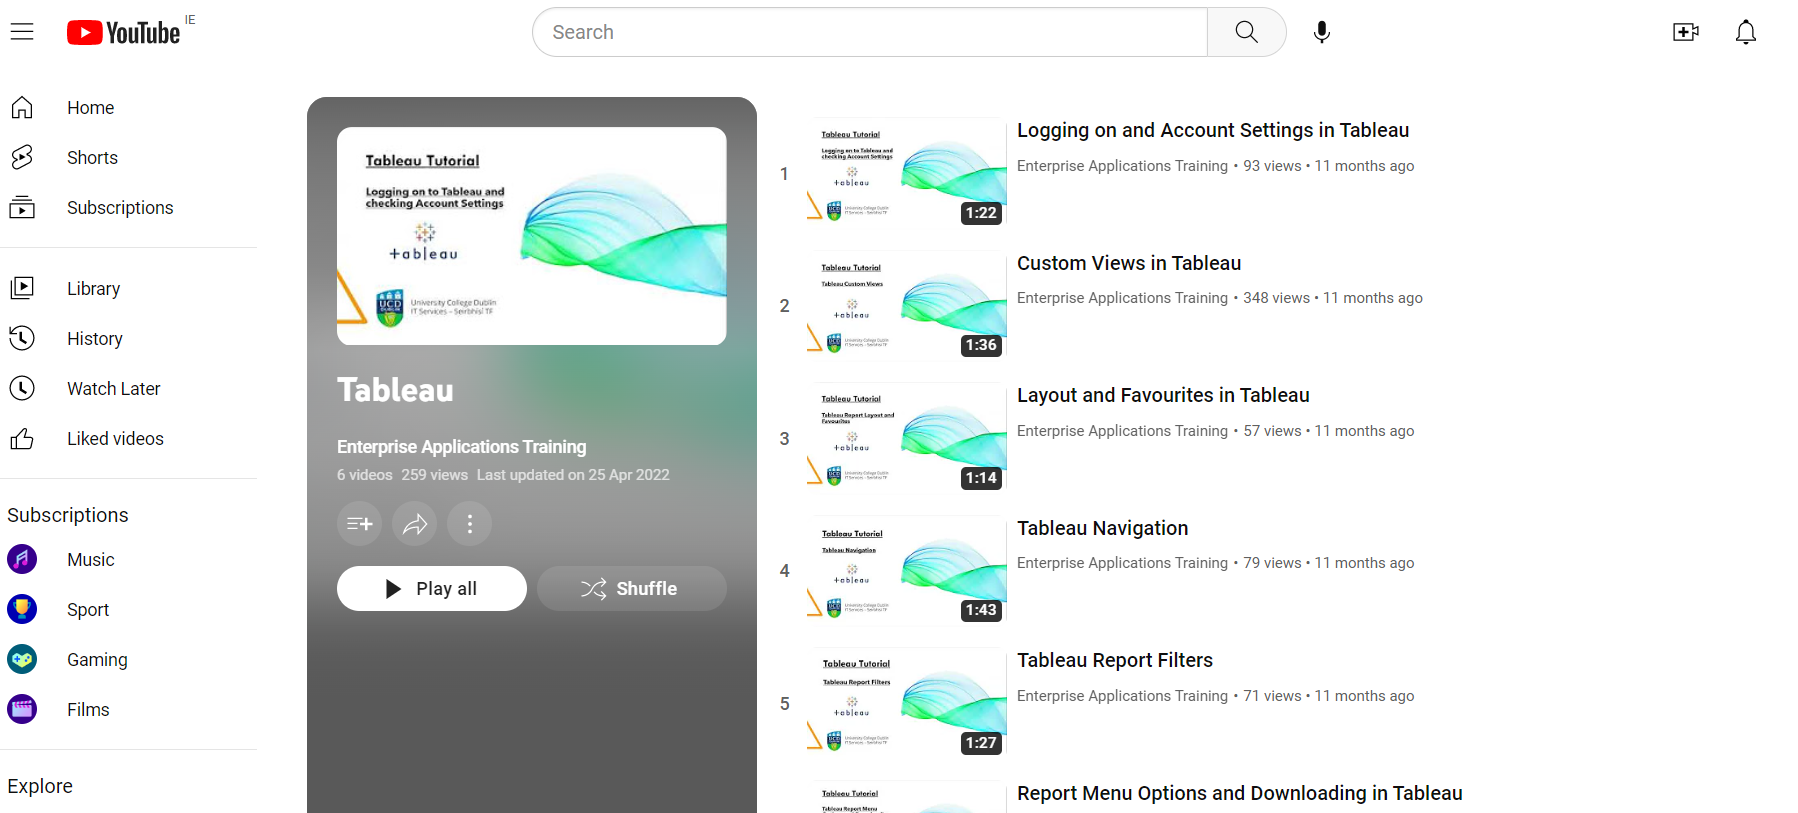
The UCD Tableau channel has links to all our training videos. These videos cover all aspects of getting starting in Tableau as a viewer; including logging in, navigating, filtering data, downloading data and more.
Our latest Tableau Viewer Training took place on Thursday, 22 May. Viewer training is for those new to Tableau, those about to start using Tableau or anyone who would like a refresher. Access the recording below.
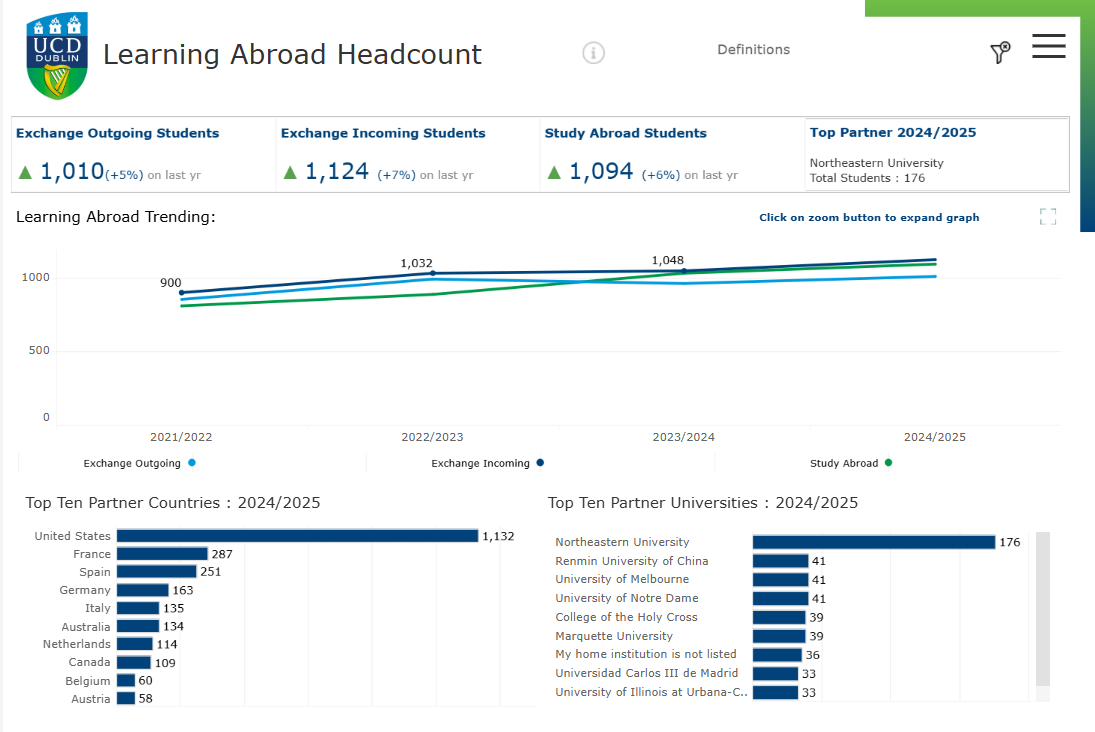
Tableau Learning Abroad Dashboard was released in February this year. This dashboard provides valuable insights into the Study Abroad, Exchange Incoming & Exchange Outgoing students; showing trends over the past number of years and a breakdown by College and Programme. Student numbers can be displayed as either headcount or FTE.
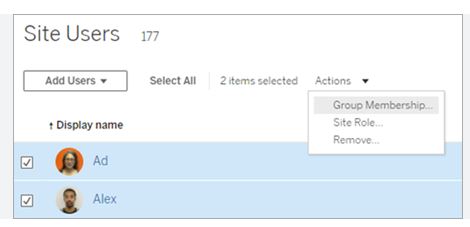
In UCD, we use Project Permissions combined with User Group management to control what a user can and cannot see in Tableau. When a user requests a Tableau Viewer account, an automatic process checks their Roles and Services in Identity Manager in InfoHub and assigns them to the appropriate User Group in Tableau. Until recently, if a user moved Team or Business area, e.g. from Registry to Global, or from HR Resourcing to HR Operations, EAG would need to be informed and would manually update their User Groups. Since November 2023, this is now handled by a nightly automatic process, seamlessly providing and removing access for users. There is no longer any need to request access to specific Tableau reporting from EAG Support - if you feel you do not have access to all the reporting you should, please contact your manager.
The aim of this project is to empower UCD users to write their own reports that can harness both the vast array and volume of data available in UCD along with the power of Tableau. In doing so the project wants them to have at their fingertips accurate, reliable data that will improve operational efficiency, enhance decision making and ultimately improve the day to day and year on year running of the University.
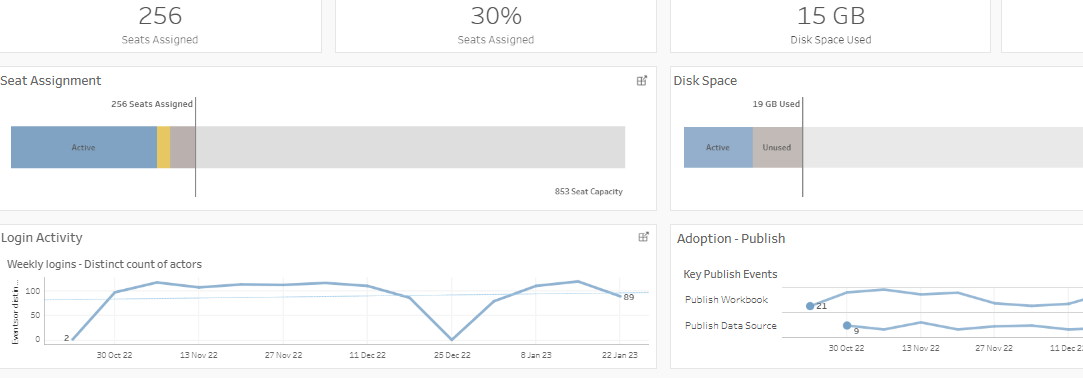
There are currently over 85 production data sources and 450+ reports being used daily by UCD Tableau users across Finance, HR, Registry and UCD Global.
Here are some other sources of information on Tableau that you might find useful
EAG - IT Services

EAG - IT Services

EAG - IT Services

EAG - IT Services

EAG - IT Services

EAG - IT Services

You can request a Tableau Reporter account via https://www.ucd.ie/ithelp or you can reach out to any member of the project team with your Tableau questions, please see the contact details above.
You can find more information on the Tableau Service page.
This project set out to replace InfoView with a modern analytics reporting platform in UCD. In October 2019 Tableau was chosen. The first Finance Tableau reports were in use by autumn 2020 followed in 2021 by Registry and HR reporting. InfoView licensing expired in December 2021 and there was a smooth transition to Tableau Reporting when the InfoView server was switched off at the end of the year. Tableau is used throughout the University with Dashboards being rolled out to provide GEG and Extenuating Circumstances analytics data.
Procurement of analytics and reporting tool; Tableau was chosen.
Development begins on Tableau Data Sources and Reports in consultation with UCD Admissions and Finance systems.
First Finance report goes into production.
First HR reports and Data Sources are used for day to day activities by UCD staff.
First Registry report goes live.
Access to long standing reporting tool InfoView is switched off as licenses expire.
Auto Provisioning for new Tableau accounts is launched, users can now request their own Tableau Viewer account via Infohub.
There are more than 85 Production data sources and 450+ reports being used daily by UCD Tableau users across Finance, HR, Registry and UCD Global.
The Tableau Webinar Series commences; quarterly webinars to update Tableau users and University staff on Tableau projects.
Tableau Dashboard Template rolled out to Report Writers to allow standard look and feel of all UCD Tableau Dashboards.
Second Global Engagement Group dashboard released. Tableau users are automatically placed in User Groups based on their Services and Roles, without the need for manual intervention.
New data sources connecting to Kx (residences) and evasys (student surveys). New dashboards for Student Recruitment and School and College profiles.
Salesforce CRM became the new Online Applications tool for UCD. Tableau Recruitment Dashboards now show application figures imported from Salesforce.
College and School Profile Dashboard gives an overview of Student and Staff population; including census data, campus details and widening participation figures.
Tableau Learning Abroad Dashboard was released. This dashboard provides valuable insights into the Study Abroad, Exchange Incoming & Exchange Outgoing students; showing trends over the past number of years and a breakdown by College and Programme.
Contact us via the UCD IT Support Hub: www.ucd.ie/ithelp