RURM Gantt
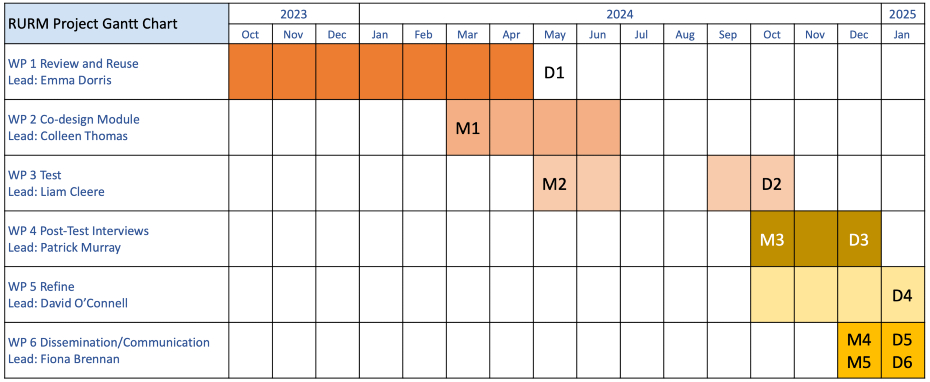
The RURM Gantt chart shows the projects 'Deliverables' and 'Milestones'.


The Gantt Chart provided outlines the structured timeline and sequence of activities for the Responsible Use of Research Metrics (RURM) project. It serves as a detailed planning tool, illustrating the start and end dates for each work package (WP) involved in the project's lifecycle. From the initial review and reuse of existing resources to the co-design workshops, testing phases, refinement of materials, and final dissemination efforts, the chart offers a comprehensive view of the project's scheduled tasks and milestones. This visualisation aids in ensuring timely execution and effective management of the project, allowing partners to monitor progress and coordinate efforts across the various stages of development.
| Deliverables |
Milestones |
| D1: Report of existing materials |
M1: Focus group participants recruited |
| D2: Dataset – quantitative pilot testing |
M2: Pilot testers recruited |
| D3: Dataset - qualitative pilot testing |
M3: Feedback participants recruited |
| D4: OER RURM Training |
M4: Datasets deposited |
| D5: Infographic video |
M5: Cross-institutional committee based in National Chapter of CoARA established to make periodic reviews and update module accordingly |
| D6: Report of recommendations for scale up of training module |