New R packages to evaluate the statistical uncertainty of causal effects more informatively
Author: Akisato Suzuki
Date: 14 September 2020
You may have come across a debate on statistical significance, most recently in a piece in Nature (Amrhein, Greenland, and McShane 2019). In inferential statistics, it is conventional to say an effect is “statistically significant” if its p-value is less than 5% (or, equivalently, its 95% confidence interval does not include zero), and “not statistically significant” otherwise. While it is convenient, this dichotomous thinking has been prone to misuses and misunderstandings (Gerber and Malhotra 2008; Esarey and Wu 2016; McShane and Gal 2016, 2017; Simonsohn, Nelson, and Simmons 2014).
In my current Irish Research Council-funded project, I have been developing more informative approaches to evaluating the uncertainty of statistically estimated causal effects. In this blog post, I will give a brief introduction to two of these approaches and their (opens in a new window)Rpackages. For more detailed explanations, please refer to the corresponding working papers (Suzuki 2020a, 2020b).
Presenting the Probabilities of Different Effect Sizes
In one of (opens in a new window)my working papers (Suzuki 2020b), I introduce an approach to plotting the probabilities of different effect sizes. More specifically, it is the plot of a complementary cumulative distribution function, which displays the probability that the effect of a causal factor is greater if a positive effect, and smaller if a negative effect, than some effect size.
The example of the plot is Figure 1 below, taken from my working paper that re-examines the analysis of the effect of an opposition group using violent methods on public support for it (Huff and Kruszewska 2016). The original study hypothesized either the positive effect or the negative effect would be possible (1778—1780), and found the effect not statistically significant at the level of p<5% in some of the statistical models. I re-examine one of those models that returned such statistical insignificance (more specifically, the one on the effect of bombing in comparison to occupation on support for tax concessions in favor of the opposition group; see Huff and Kruszewska 2016, 1794).
Figure 1. Example of the ccdfpost package: The effect of bombing in comparison to occupation on public support for an opposition group.
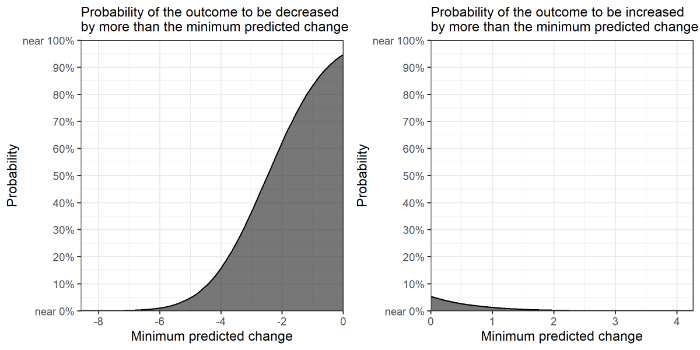
The left panel presents the probability that the effect of bombing in comparison to occupation is smaller than zero (i.e., the probability of a negative effect on public support), while the right panel displays the probability that the effect of the same causal factor is greater than zero (i.e., the probability of a positive effect on public support). The x-axis is the effect sizes measured as minimum predicted changes in the outcome (here, the percentage of tax concessions in favor of an opposition group); the y-axis is the probability of the effect.
From the figure, we can see, for example, the causal factor is much more probable to have a negative effect than a positive effect. It is also possible to see the probability given a certain effect size. For example, the probability of the effect being smaller than –2 is approximately 63%. This is richer inference than simply stating the effect is statistically significant or not. We do not need to use decision thresholds such as a p-value of 5% to dichotomously decide whether the effect is significant or not. We simply play a role of information provider, presenting different probable effect sizes with their probabilities.
My R package (opens in a new window)ccdfpost enables you to produce this plot. It uses the posterior samples of a causal effect estimated by Bayesian statistics. In the (opens in a new window)package’s vignette, I give a quick example to use a Bayesian regression to estimate posterior samples, so you can try it yourself if you are not familiar with Bayesian statistics.
A Decision-Theoretic Model for Binary Outcomes
In (opens in a new window)another working paper of mine (Suzuki 2020a), I propose a Bayesian decision-theoretic model to compute an expected loss given the estimate of an effect size, its probability, and the costs of an intervention (e.g., a treatment or policy implementation) and of an undesirable event (such as war). The model integrates all of statistical uncertainty, a variation in estimated effect sizes, and the practical relevance of statistical estimates, into one single framework. It is currently available only for binary outcome variables.
Figure 2 below is an example, taken from one of the replication analyses in my working paper. The intervention is to include the provision of harsh retributive justice against a rebel group in a peace agreement, and the undesirable outcome is people not supporting the agreement (Tellez 2019). The original study (Tellez 2019)found based on the Columbian case that the provision of harsh retributive justice has a statistically significant effect to decrease the likelihood of people not supporting the agreement.
Figure 2: Example of the bayesdtm package: Expected losses given the presence or absence of harsh retributive justice
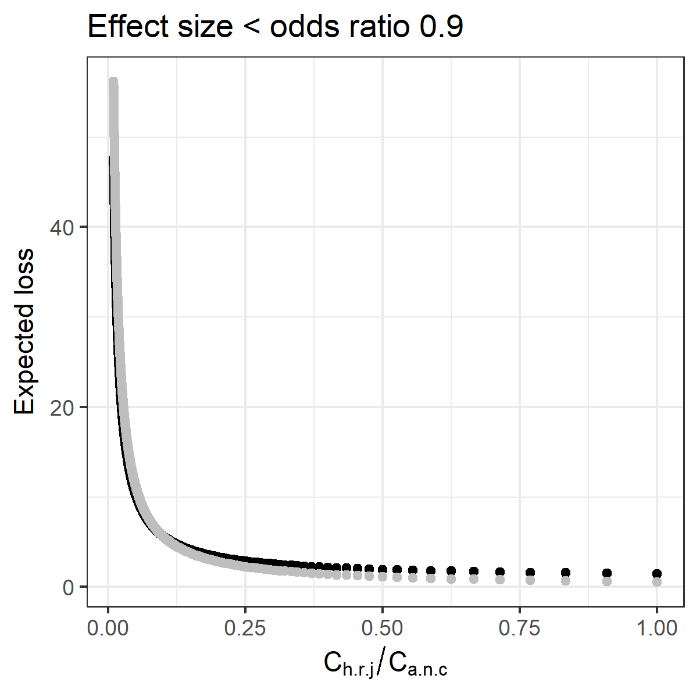
The x-axis is the ratio of the cost of the intervention to the cost of the undesirable outcome. The cost of putting the provision of harsh retributive justice (Ch.r.j.) might be considered, for example, as failing to obtain support from a rebel group. The cost of people choosing not to support the peace agreement (Ca.n.c) might be considered, for example, as political leaders losing next elections. The ratio of the two costs is calculated here, in the way that the former cost is fixed at the value of one and the latter cost is varied from one to hundred. The y-axis is expected losses. A smaller expected loss means a less costly outcome is expected. The black dots are expected losses given the intervention; the grey dots are those given no intervention. In this example, the odds ratio of 0.9, or approximately a 2% reduction in the likelihood of the undesirable event here, is used as the minimum desired effect size. In other words, the effect size under consideration is anything that reduces the likelihood of people not supporting a peace agreement, by greater than (approximately) 2%.
The figure indicates that as the ratio of the two costs increases (i.e., as the cost of the undesirable event becomes smaller), the expected loss given the intervention becomes greater and eventually exceeds the expected loss given no intervention (more specifically, at the ratio of approximately 0.096). While the original study finds “retributive justice attributes have some of the largest effects on the probability that an agreement is chosen” (Tellez 2019, 835), the decision-theoretic model enables further inference, suggesting how efficient harsh retributive justice as a policy would be.
The general implication is that, even if a statistical model shows an intervention has a statistically significant effect to reduce the likelihood of an undesirable outcome, whether it is the optimal decision also depends on the ratio of the two costs. It is possible that the relative cost of an intervention is so large that it will not produce a smaller expected loss than when no intervention is done. Similarly, it is also possible that, even if a statistical model shows an intervention does not have a statistically significant effect to reduce the likelihood of an undesirable outcome, its relative cost is so small that it will produce a smaller expected loss than when no intervention is done. In short, the decision-theoretic model evaluates the significance of an intervention by fully incorporating probable effect sizes, their probabilities, and the ratio of the cost of an intervention to the cost of an undesirable outcome.
My R package, (opens in a new window)bayesdtm, enables you to compute expected losses with and without an intervention and plot them as in Figure 2. As in the ccdfpost package, it uses the posterior samples of a causal effect, at the moment only those estimated by Bayesian logistic regression. In the (opens in a new window)package’s vignette, I give a quick example to use a Bayesian logistic regression to estimate posterior samples.
Conclusion
My suggested approaches are by no means perfect. As the ASA’s statement on p-values say: “No single index should substitute for scientific reasoning” (Wasserstein and Lazar 2016, 132). Nonetheless, I hope my approaches will contribute to a discussion over how to better evaluate the uncertainty of statistically estimated causal effects. The R codes to reproduce the above figures are available at (opens in a new window)https://akisatosuzuki.github.io/papers.html.
Acknowledgement
I would like to thank those who gave me helpful comments. The views expressed are mine unless otherwise stated. This research project was supported by funding provided by the Irish Research Council [the grant number: GOIPD/2018/328].
References
Amrhein, Valentin, Sander Greenland, and Blake McShane. 2019. “Retire Statistical Significance.” Nature567: 305–7.
Esarey, Justin, and Ahra Wu. 2016. “Measuring the Effects of Publication Bias in Political Science.” Research & Politics3 (3): 1–9.
Gerber, Alan, and Neil Malhotra. 2008. “Do Statistical Reporting Standards Affect What Is Published? Publication Bias in Two Leading Political Science Journals.” Quarterly Journal of Political Science3 (3): 313–26.
Huff, Connor, and Dominika Kruszewska. 2016. “Banners, Barricades, and Bombs: The Tactical Choices of Social Movements and Public Opinion.” Comparative Political Studies49 (13): 1774–1808.
McShane, Blakeley B., and David Gal. 2016. “Blinding Us to the Obvious? The Effect of Statistical Training on the Evaluation of Evidence.” Management Science62 (6): 1707–18.
———. 2017. “Statistical Significance and the Dichotomization of Evidence.”Journal of the American Statistical Association112 (519): 885–95.
Simonsohn, Uri, Leif D. Nelson, and Joseph P. Simmons. 2014. “P-Curve: A Key to the File-Drawer.” Journal of Experimental Psychology: General143 (2): 534–47.
Suzuki, Akisato. 2020a. “Policy Implications of Statistical Estimates: A General Bayesian Decision-Theoretic Model for Binary Outcomes.” 2008.10903 [stat.ME]. (opens in a new window)https://arxiv.org/abs/2008.10903(opens in a new window).
———. 2020b. “Presenting the Probabilities of Different Effect Sizes: Towards a Better Understanding and Communication of Statistical Uncertainty.” 2008.07478 [stat.AP]. https://arxiv.org/abs/2008.07478.
Tellez, Juan Fernando. 2019. “Peace Agreement Design and Public Support for Peace: Evidence from Colombia.” Journal of Peace Research56 (6): 827–44.
Wasserstein, Ronald L., and Nicole A. Lazar. 2016. “The ASA’s Statement on p-Values: Context, Process, and Purpose.” The American Statistician70 (2): 129–33.