Infographics and graphical abstracts
A good infographic takes the heavy-lifting out of explaining complex research, and can be designed in sharable formats for social media and other channels. Infographics might include some element of data visualisation, so check out our dedicated page on how to create them.
They can be also used to create a so-called "graphical abstract", a single image that gives a quick overview of your paper or article, helping draw attention to it. As well as on social media, graphical abstracts can help your research stand out at conferences, in media releases, in presentations (see below), and in your manuscript itself. Although many graphical abstracts take the form of an infographic, some researchers might choose to make a more creative visual summary (like a comic, a movie-style poster or even a video).
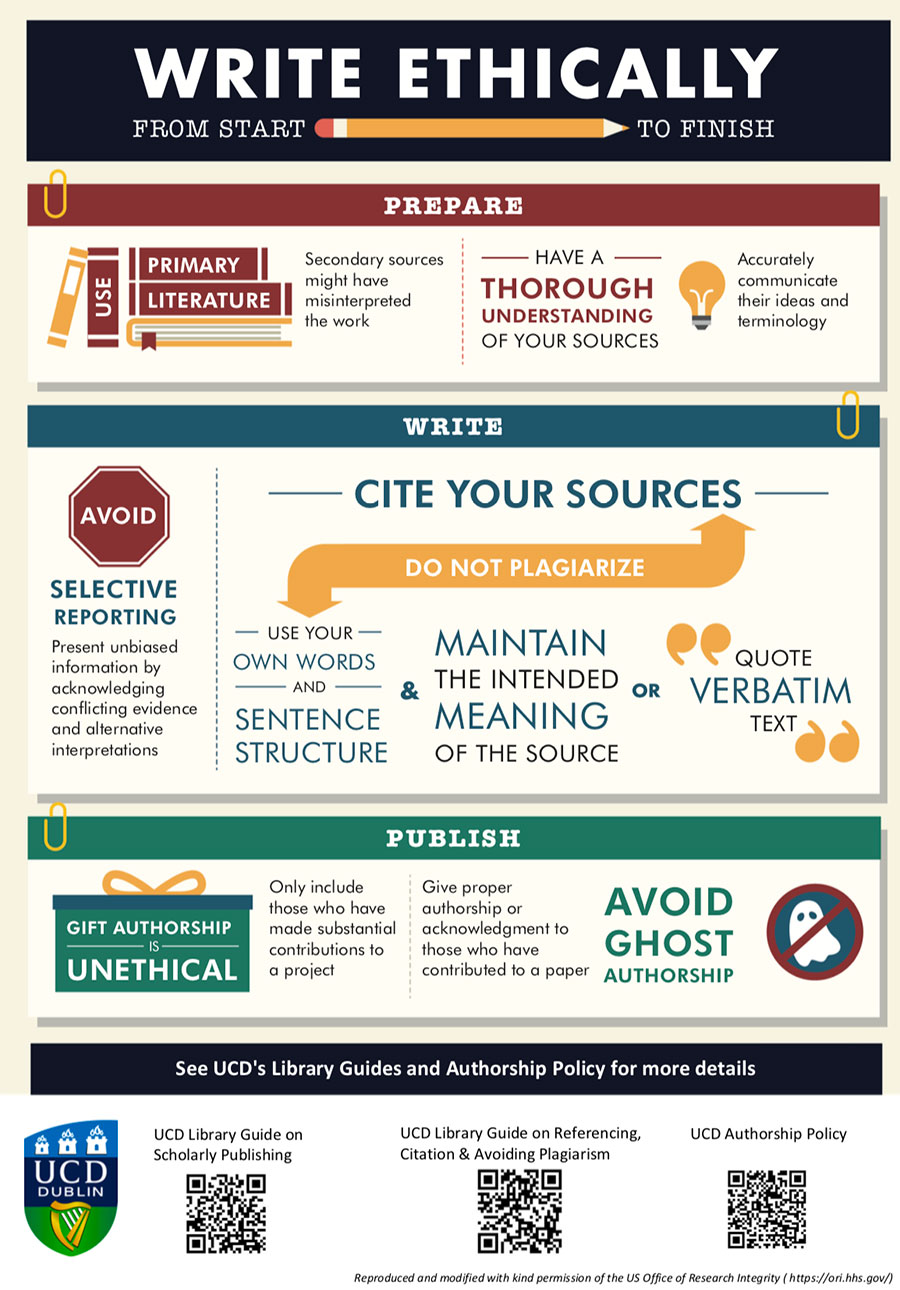
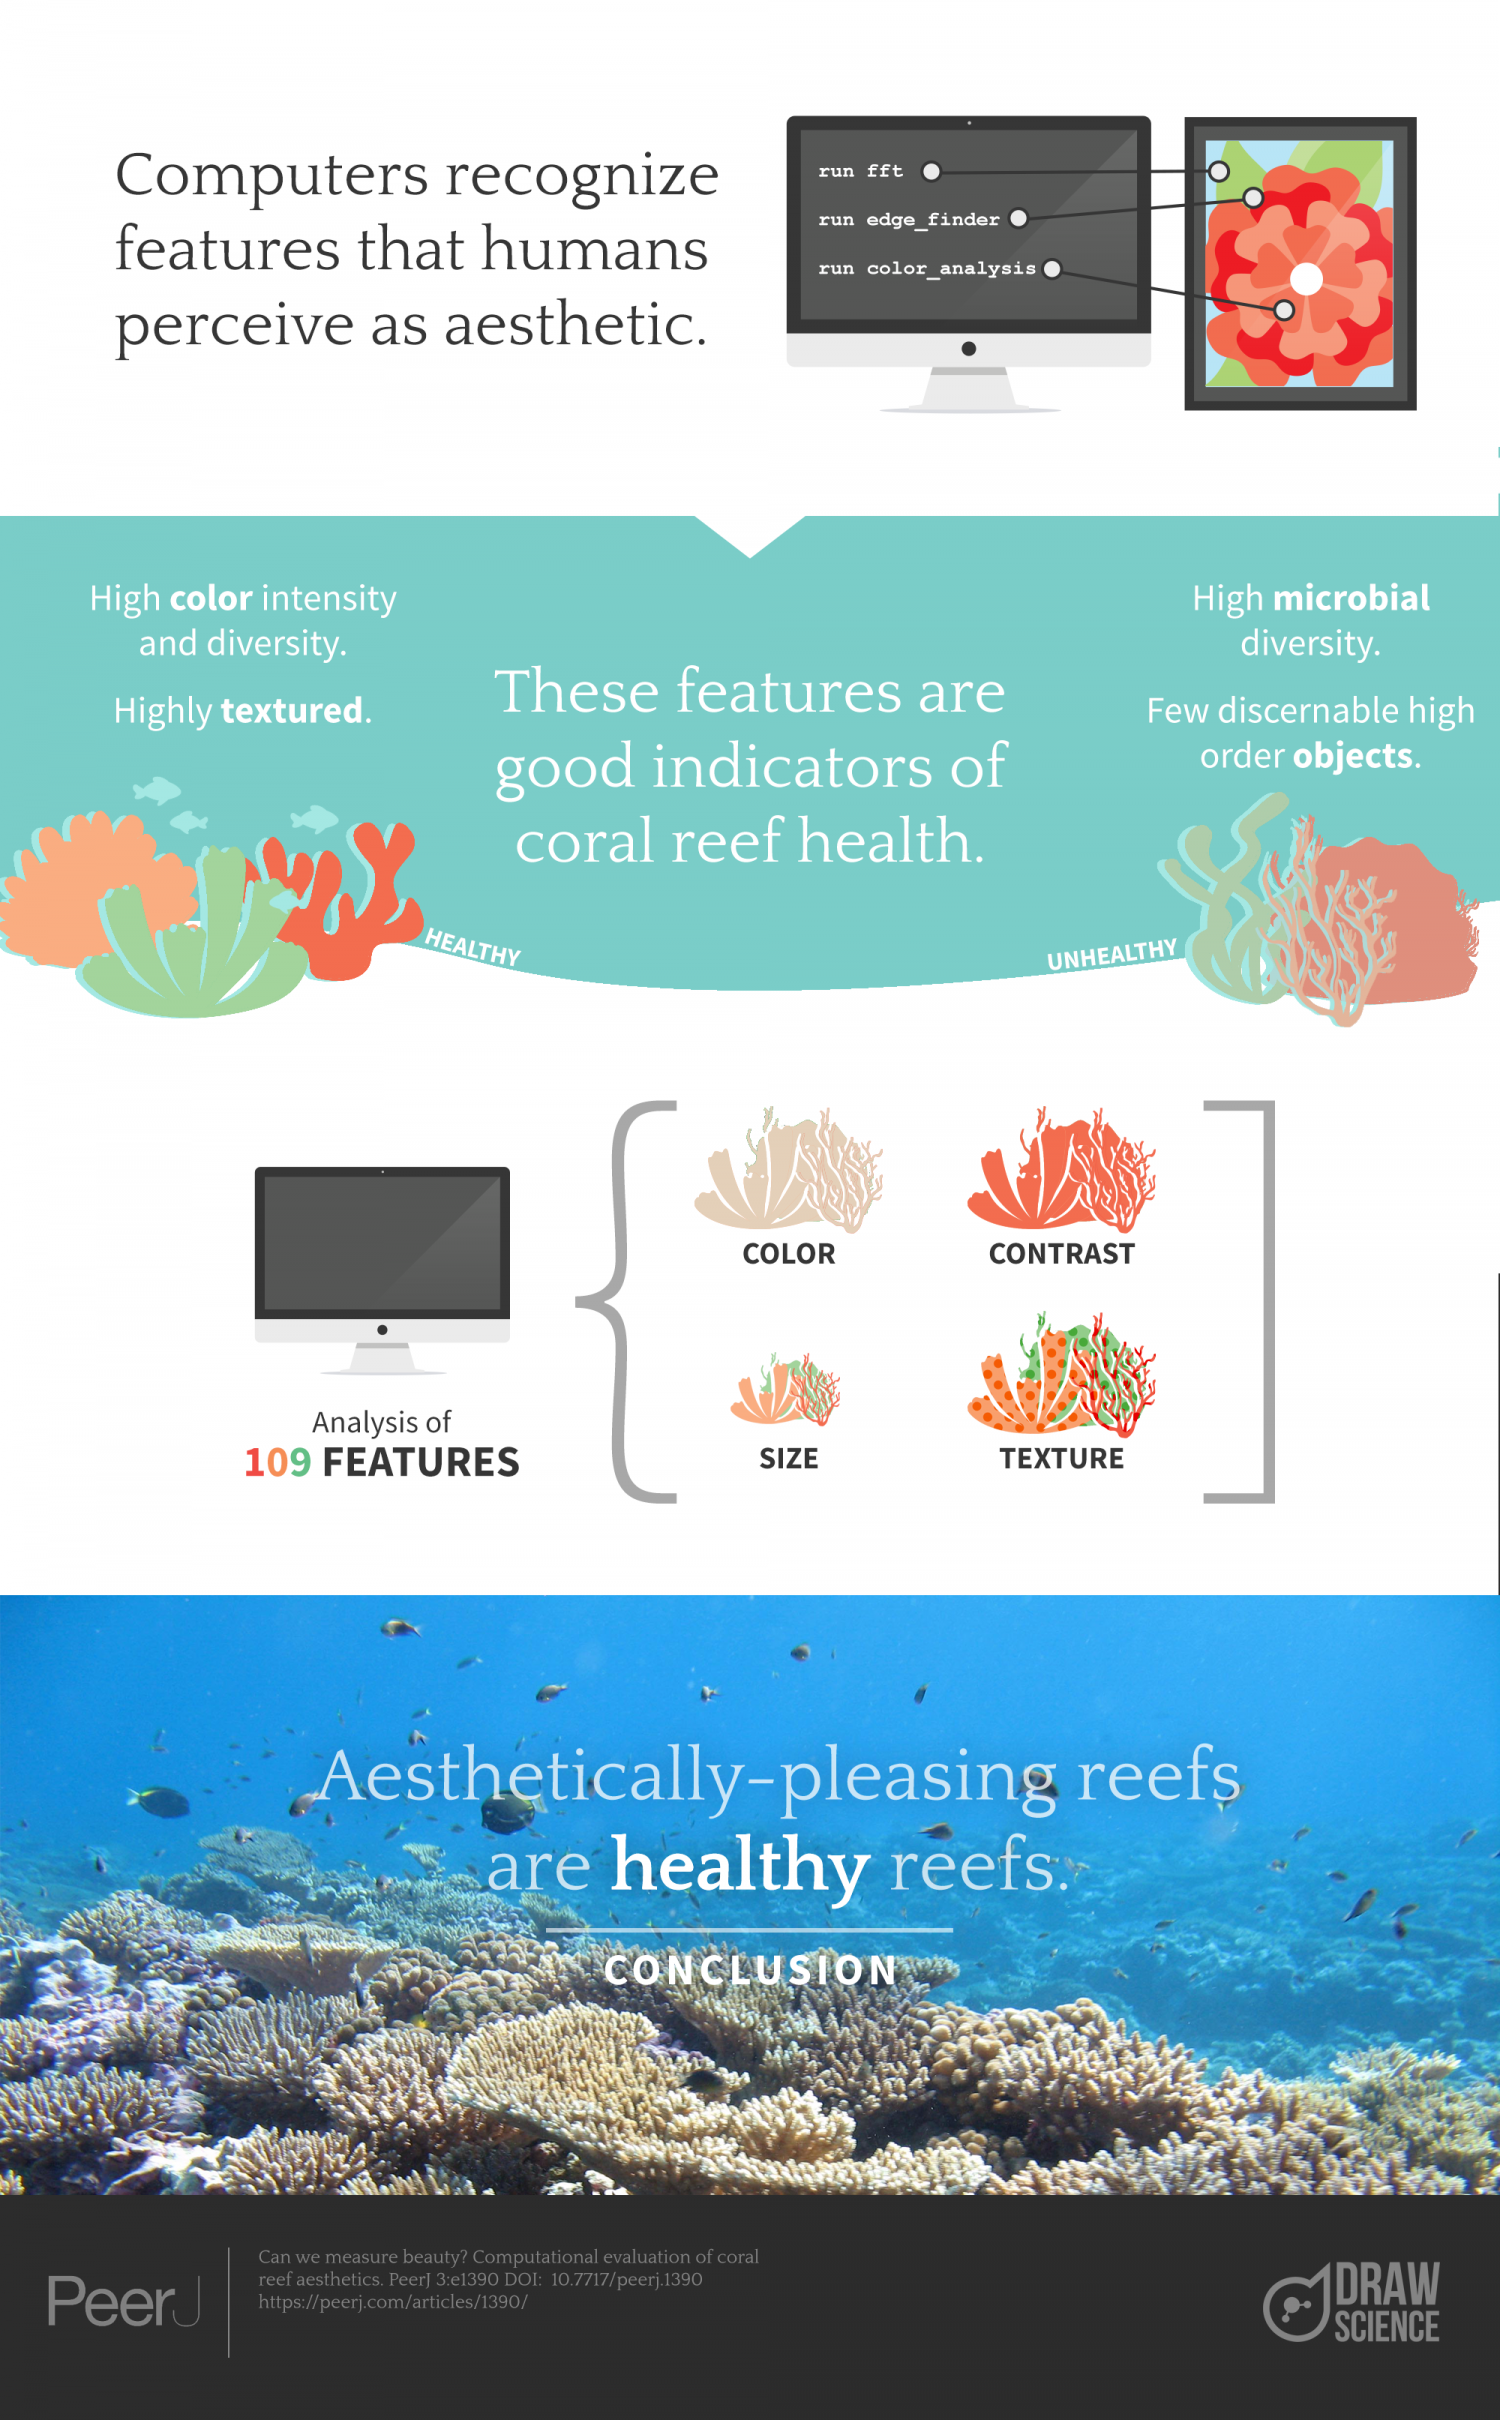
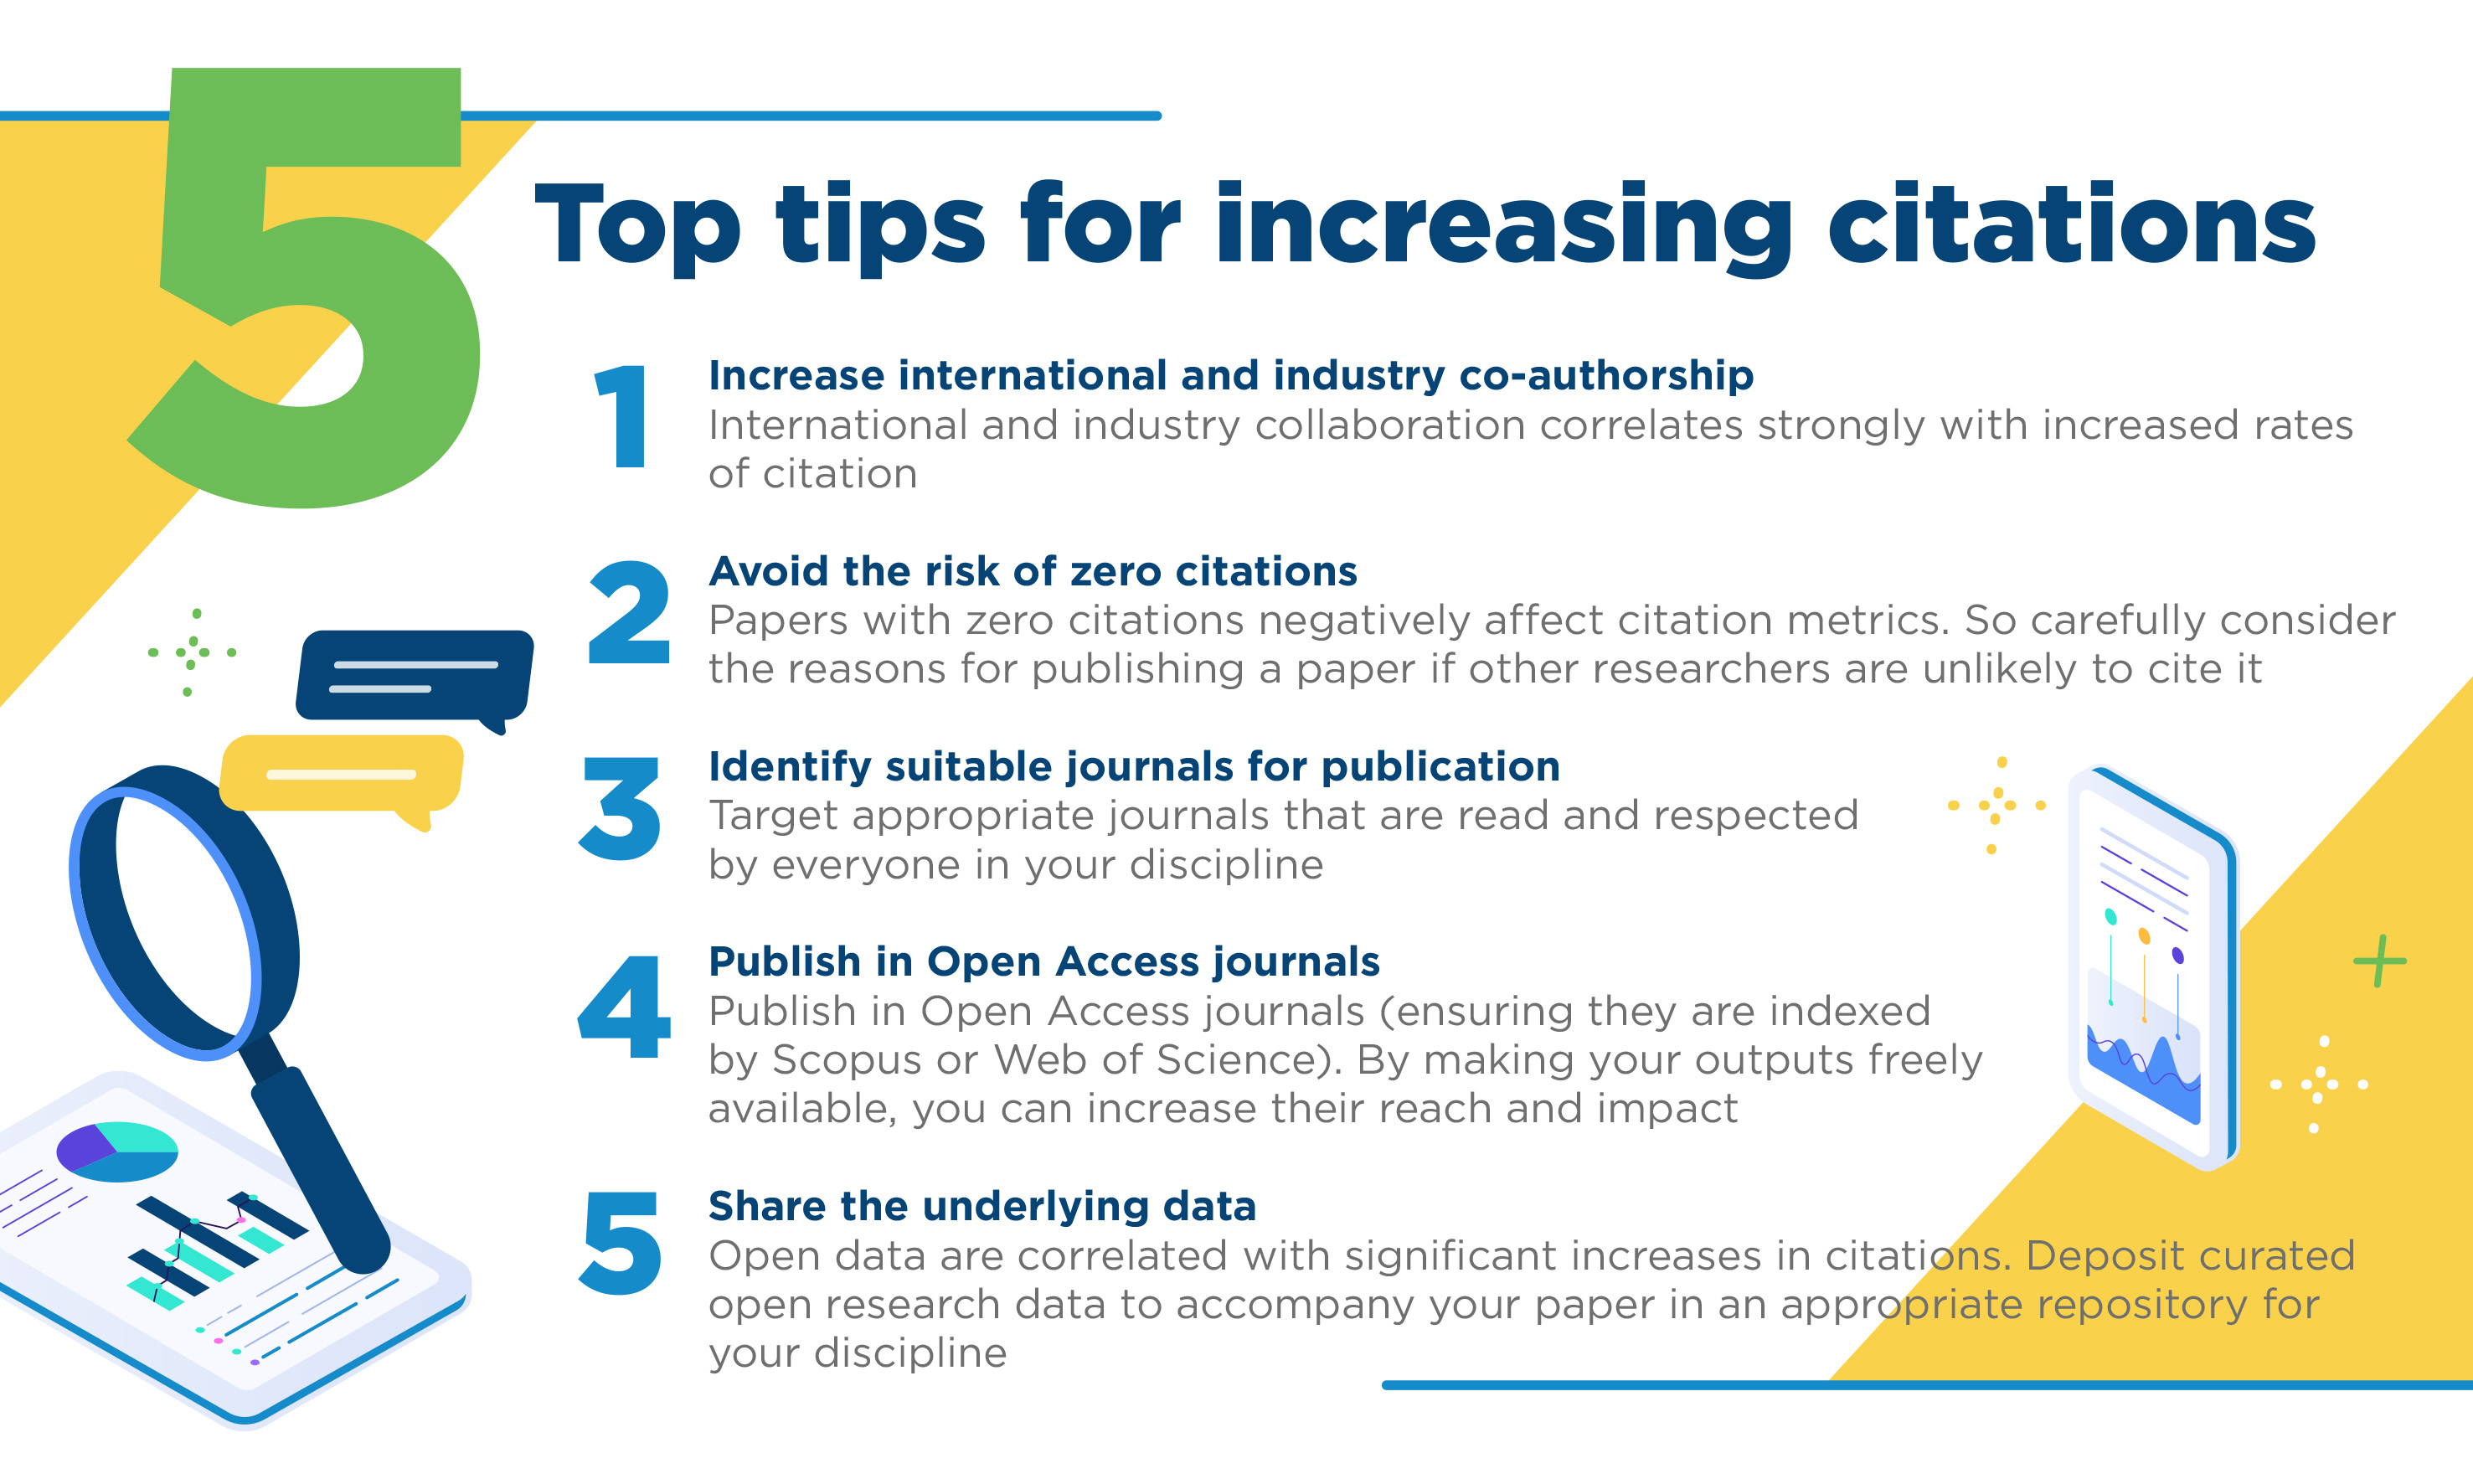
To the right is an example of a graphical abstract from the PeerJ journal (credit: Viputheshwar Sitaraman / (opens in a new window)Draw Science). Below are a couple more examples of infographics from here at UCD.
You can create your own infographic from scratch using software like Microsoft Powerpoint, or use free or paid online services which offer templates that do the work for you, such as:
- (opens in a new window)Piktochart
- (opens in a new window)Canva
- (opens in a new window)Venngage
- (opens in a new window)Infogram
![]() Lib Guide! Consult UCD Library's (opens in a new window)guidance on creating graphics and using free images or the UCD image catalogue. Find further advice on how to turn your research into an infographic in Professor Mark Reed's (opens in a new window)Fast Track Impact blog post.
Lib Guide! Consult UCD Library's (opens in a new window)guidance on creating graphics and using free images or the UCD image catalogue. Find further advice on how to turn your research into an infographic in Professor Mark Reed's (opens in a new window)Fast Track Impact blog post.
Presentations
We've all witnessed a terrible PowerPoint presentation: too many slides; far too much text on each slide (in large blocks of text, in a tiny font); too few images; images that are too small or blurry; animations popping out all over the place; and links or videos that don't work on the day.
It's a shame, as a good presentation can achieve so much. To avoid all the typical mistakes, follow these simple rules of thumb:
- As much as possible, abide by the "6 by 6" rule: no more than six words per line, and no more than six bullet points per slide.
- Avoid clashing colours, colourblind combinations (red/green), and colours that fade next to one another. Use simple contrasting or complementary colours, e.g. light text on dark background.
- Use images but (in general) just one to two per slide is enough. Use images of reasonable quality and make sure that they're relevant and interesting – they are talking points for your presentation.
- Keep your slides simple. Don't make them too busy with lots of different animations, and keep the style consistent throughout.
- Practice! For the most part, you should deliver your presentation facing your audience, not your slides. And make sure it all works before you begin.
Presentations do not need to be really stylish, but the better yours looks, the more enjoyable it will be to watch. If you're not much of a designer and don't want to stretch to paying a professional, use online tools such as those mentioned above, or a service like (opens in a new window)Templafy for a PowerPoint-specific option.
Tip: See the World Blind Union's
(opens in a new window)guide to accessible document and presentation design for people with impairments such as low vision, colour blindness and dyslexia.
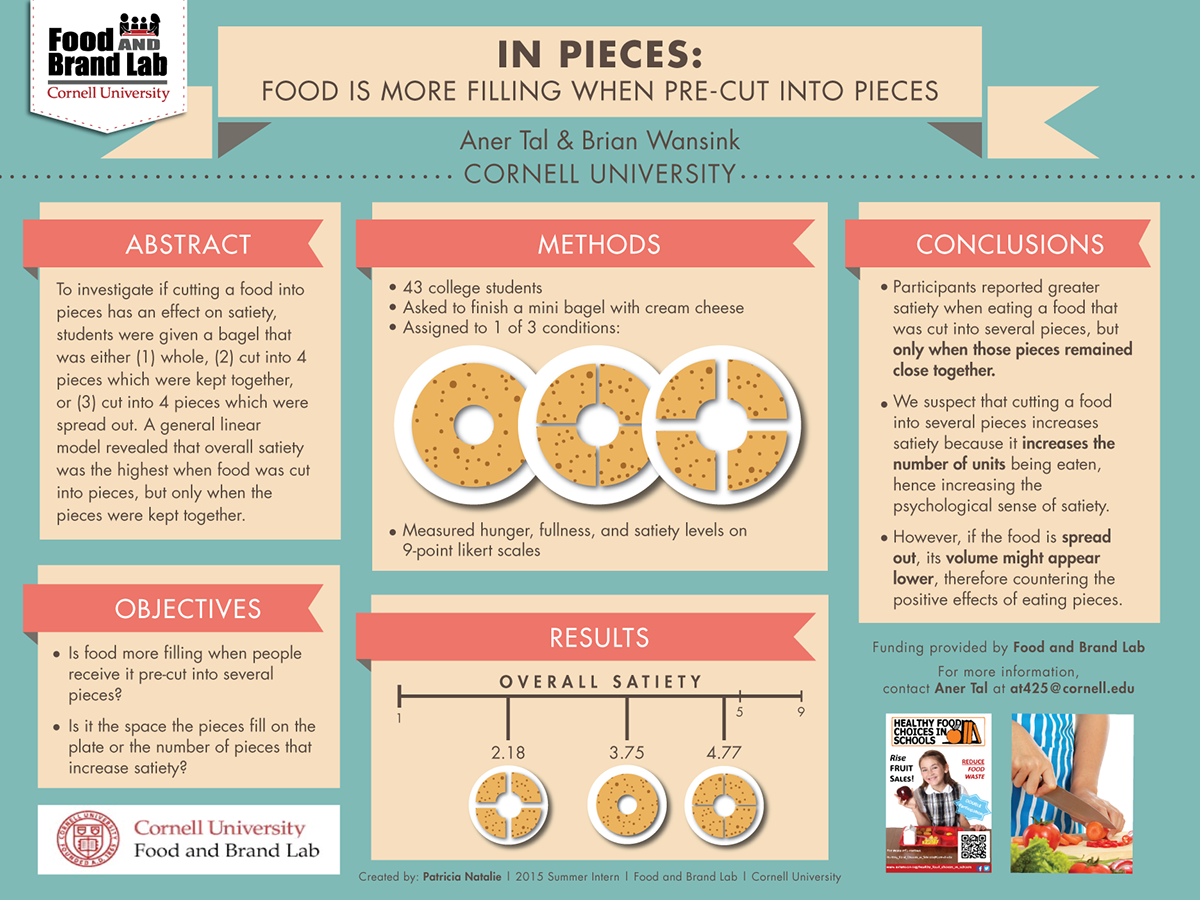
Research posters
Research posters remain a favoured communications format, particularly at conferences, fairs and exhibitions. You can find a wealth of guidance and tutorials online with a quick search, but there are general principles that apply when creating a research poster:
- Information is generally broken down into distinct sections, such as Background, Objectives, Methodology, Results, and Recommendations. A typical poster will have 4-8 of these sections laid out in 3 or 4 columns – your decisions on layout should be guided by what best helps the information flow for the reader. But don't be constrained by this: some of the best research posters use unique layouts to get the information across.
- It should be easy to read. And ideally from a few feet away – don't use too much text!
- Formatting should be consistent across the poster.
- Your poster should generally include graphics, and they should (i) make sense and (ii) be of high quality.
- Any graphs or visuals must be easy to understand by all of your intended audiences.
- When completed, your key points of information should stand out clearly.
For more comprehensive guidance, including graphics and file formats and online resources and tutorials, see poster production and digital poster resources from UCD Teaching and Learning. Find more examples and ideas for poster design at the (opens in a new window)Academic Research Poster Design Blog.
Flyers
Digital flyers are small images that you can share on social media posts or by email. They can help you communicate your actual research findings, as in the infographic form mentioned above. But they can also be used to (opens in a new window)advertise a seminar or (opens in a new window)conference; to (opens in a new window)share an opportunity or (opens in a new window)an accomplishment; to (opens in a new window)raise awareness; or to (opens in a new window)promote a book or (opens in a new window)journal article. Flyers can also take the form of animated GIFs, like (opens in a new window)this one from The Lancet.
The (opens in a new window)@UCDLibrary Spotlight for August focuses on the newer Irish language and Irish themed books in our collection. Browse or borrow from our display on level 1 of the James Joyce Library. For more info see: (opens in a new window)https://t.co/oI0vmrqlJw (opens in a new window)pic.twitter.com/HOfAHVuJHP
— UCD Library (@UCDLibrary) (opens in a new window)August 9, 2022
There are many ways to use flyers and images on social media. Whatever you use them for, they're a great way to increase engagement. Posts with images stand out more in the newsfeeds of Twitter or LinkedIn users. The ability to tag such posts also increases their potential reach, drawing attention to them in the tagged users' notifications. For this reason, it is best to create flyers designed to work with Twitter, but which also work on other platforms.
![]() Lib Guide! See (opens in a new window)further guidance from UCD Library on how to create these type of graphics using Powerpoint and Canva, and how to use free images from UCD and other online sources sources.
Lib Guide! See (opens in a new window)further guidance from UCD Library on how to create these type of graphics using Powerpoint and Canva, and how to use free images from UCD and other online sources sources.